Many say that markets are unpredictable, but that isn’t entirely true. Some price chart patterns, like the double top chart pattern, are repeatable and can help predict important price actions.
One of the most impactful price actions most traders look for is trend reversal patterns. Especially when margin trading, traders can take advantage of upward and downward movements.
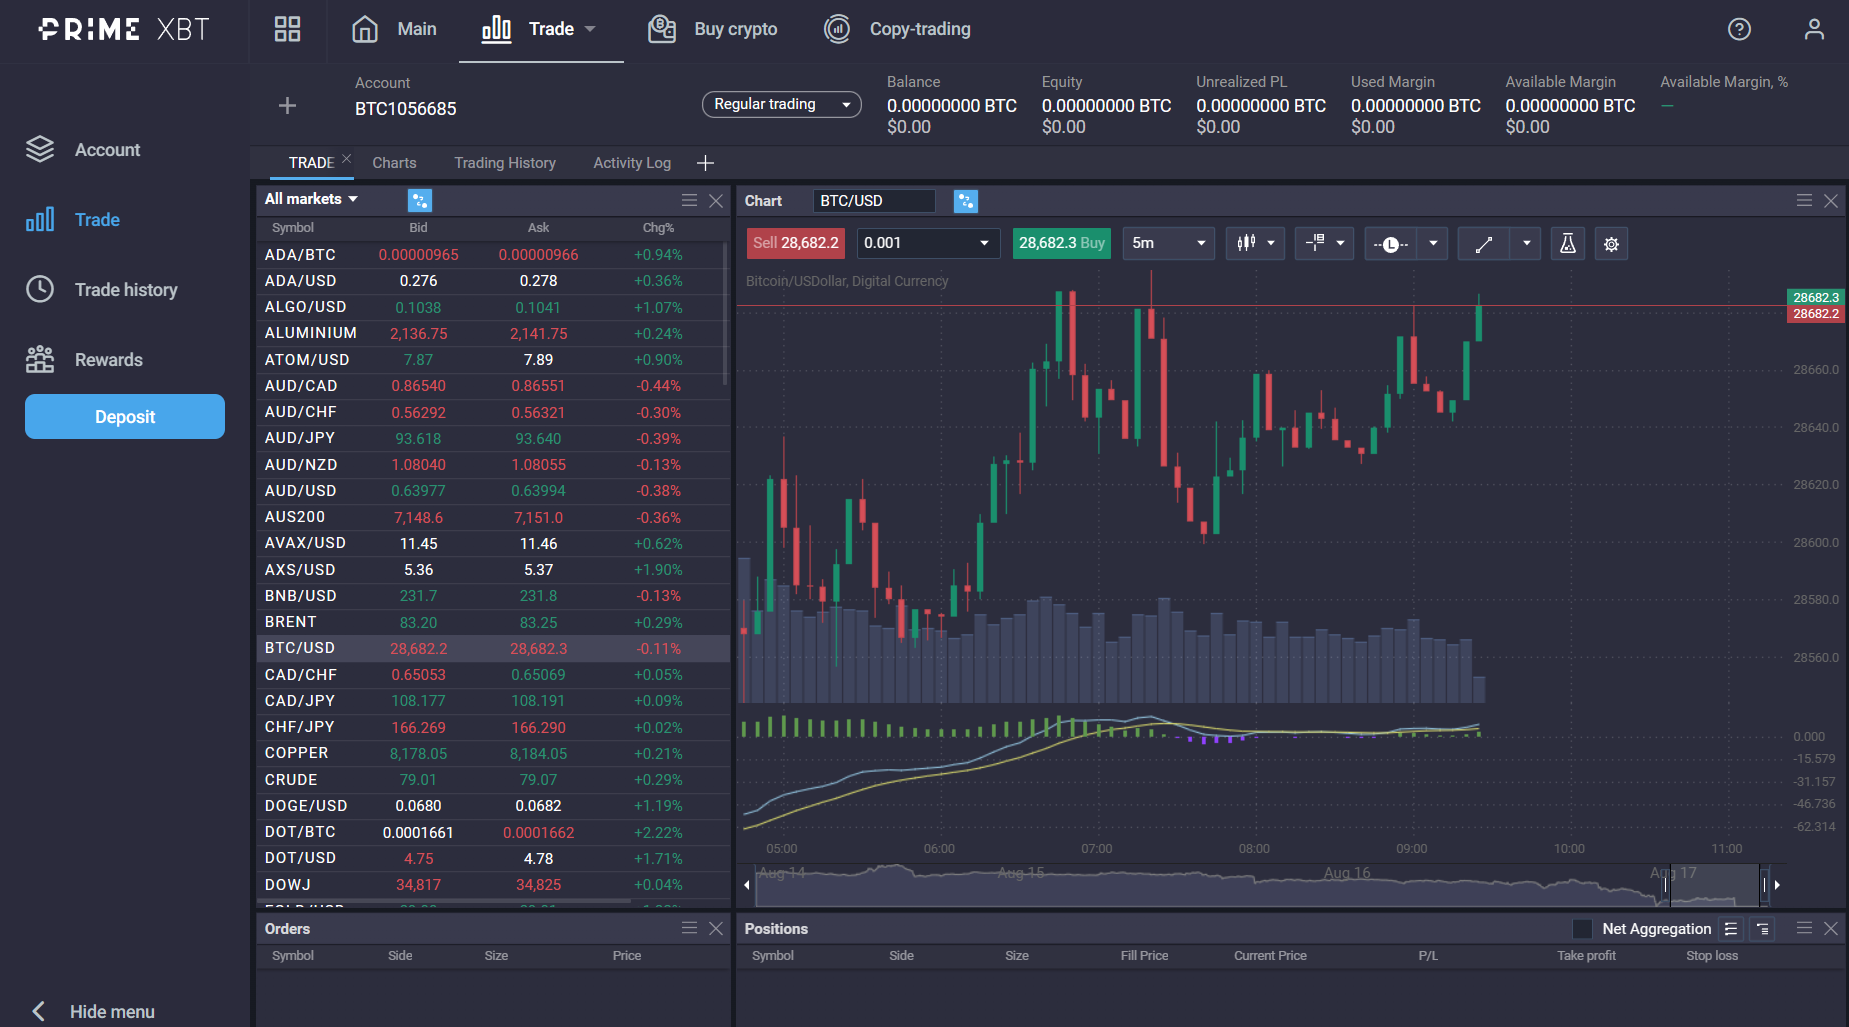
Double top patterns are considered a “bearish reversal pattern,” i.e. a pattern created before a downward reversal after an upward trend.
This article will help you recognize and use the double top pattern to optimise your returns from your trading and investing activities.
Understanding Chart Patterns in Technical Analysis

Technical analysis is based on analysing and interpreting chart patterns created to predict market movements. It usually uses past price market data to make these analyses. Often you will see various graphic interpretations of these analyses, called technical indicators.
Technical indicators are mathematical calculations made into graphic interpretations and should not be confused with chart patterns, although they are also used when performing technical analysis.
If you are still a bit confused, chart patterns are created by candlesticks or lines that follow the instrument’s price. Indicators are “drawn” over the chart, like the vertical yellow line in the image above.
As with most analysis methods, the basic rule is supply and demand. When supply outweighs demand the price of the instrument climbs; when the opposite is true, the price drops.
If both supply and demand are equal, then the price moves “sideways” i.e. it doesn’t change. Building on those concepts, technical analysis also looks for a support level or a resistance level based on market sentiment.
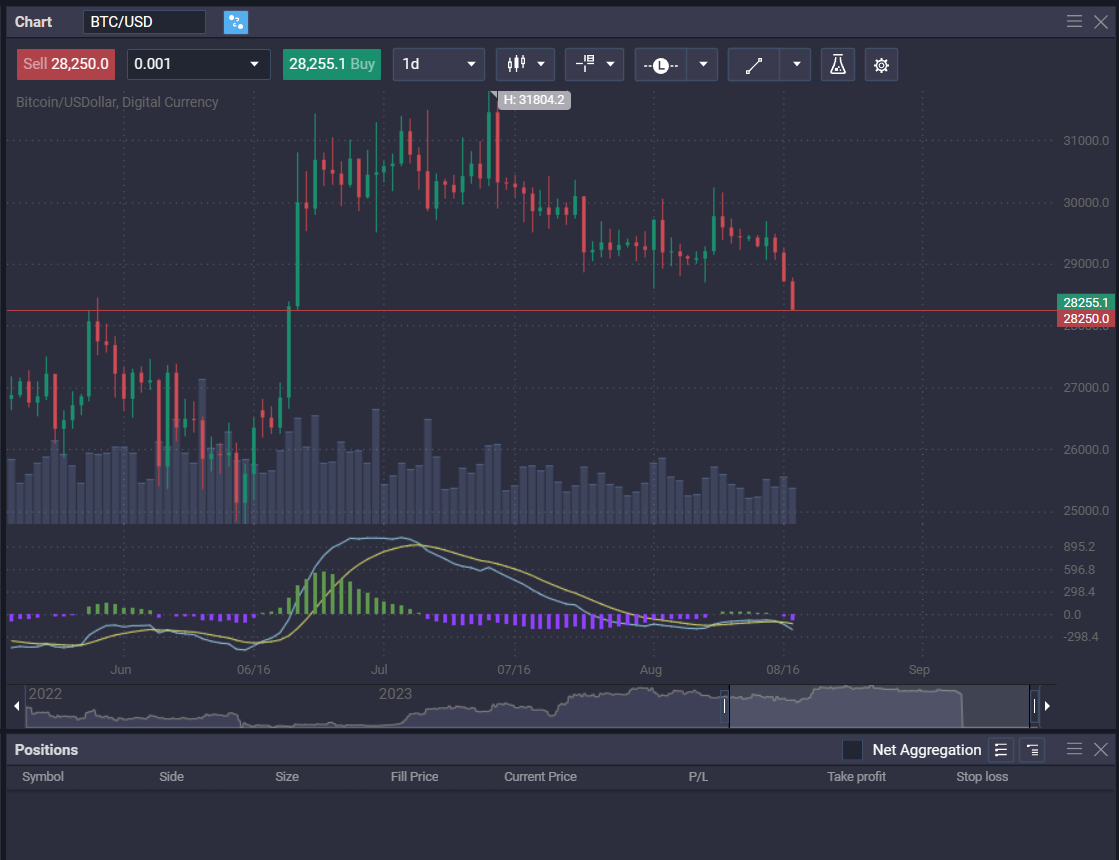
As the price of an instrument drops, it attracts more buyers, causing demand to reach supply levels and “pause” the price; this price or range of prices is called the support level.
One the opposite side of this dynamic, as a price climbs, investors or traders will sell off their assets for profit. Eventually, this will meet the demand level and pause the price again. This is called the resistance level.
An easy way to remember the difference between these two levels is support “supports” the price from going lower, whereas resistance “resists” the price from going higher.
Every time the price bounces off these levels it is called “testing” and most market experts say that a support or resistance level is confirmed only after being tested at least three times. However, this recommendation is overlooked when the pattern forms.
These are some of the fundamentals you need to know to better understand the double top pattern and use it to your advantage.
Zooming In: What is the Double Top Pattern?
Defining the Double Top
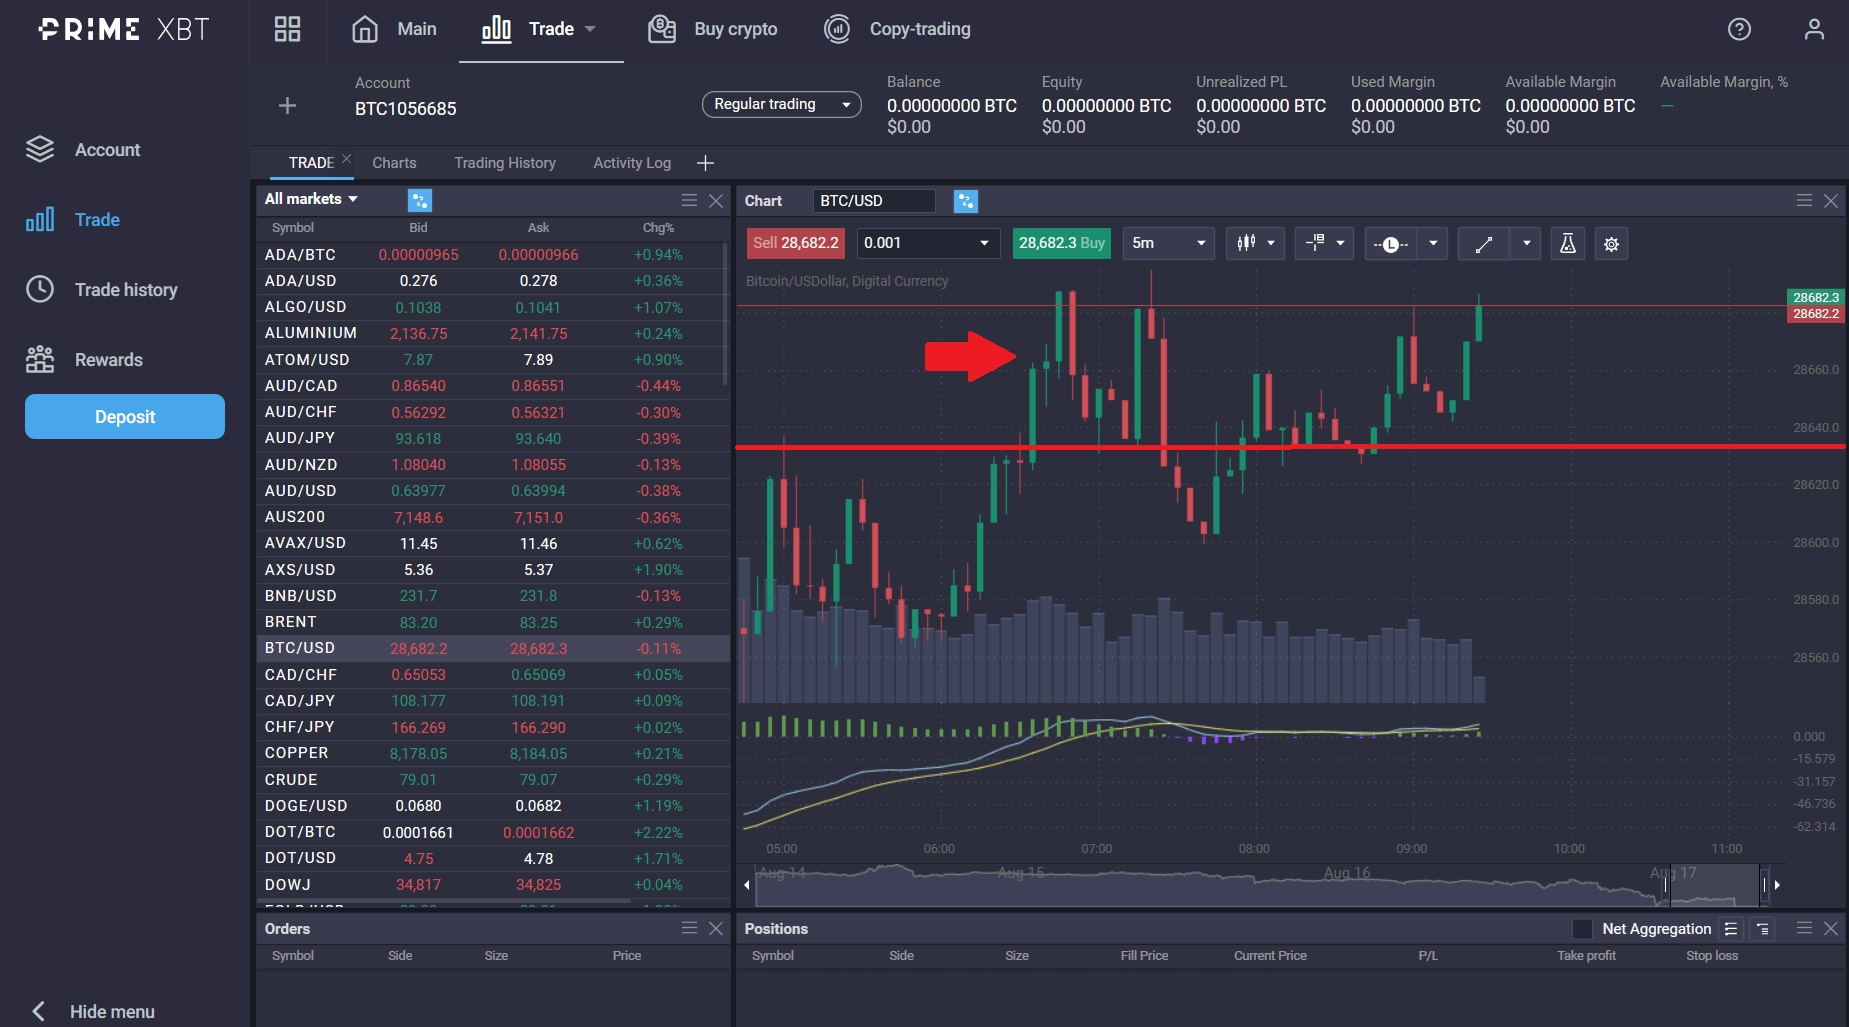
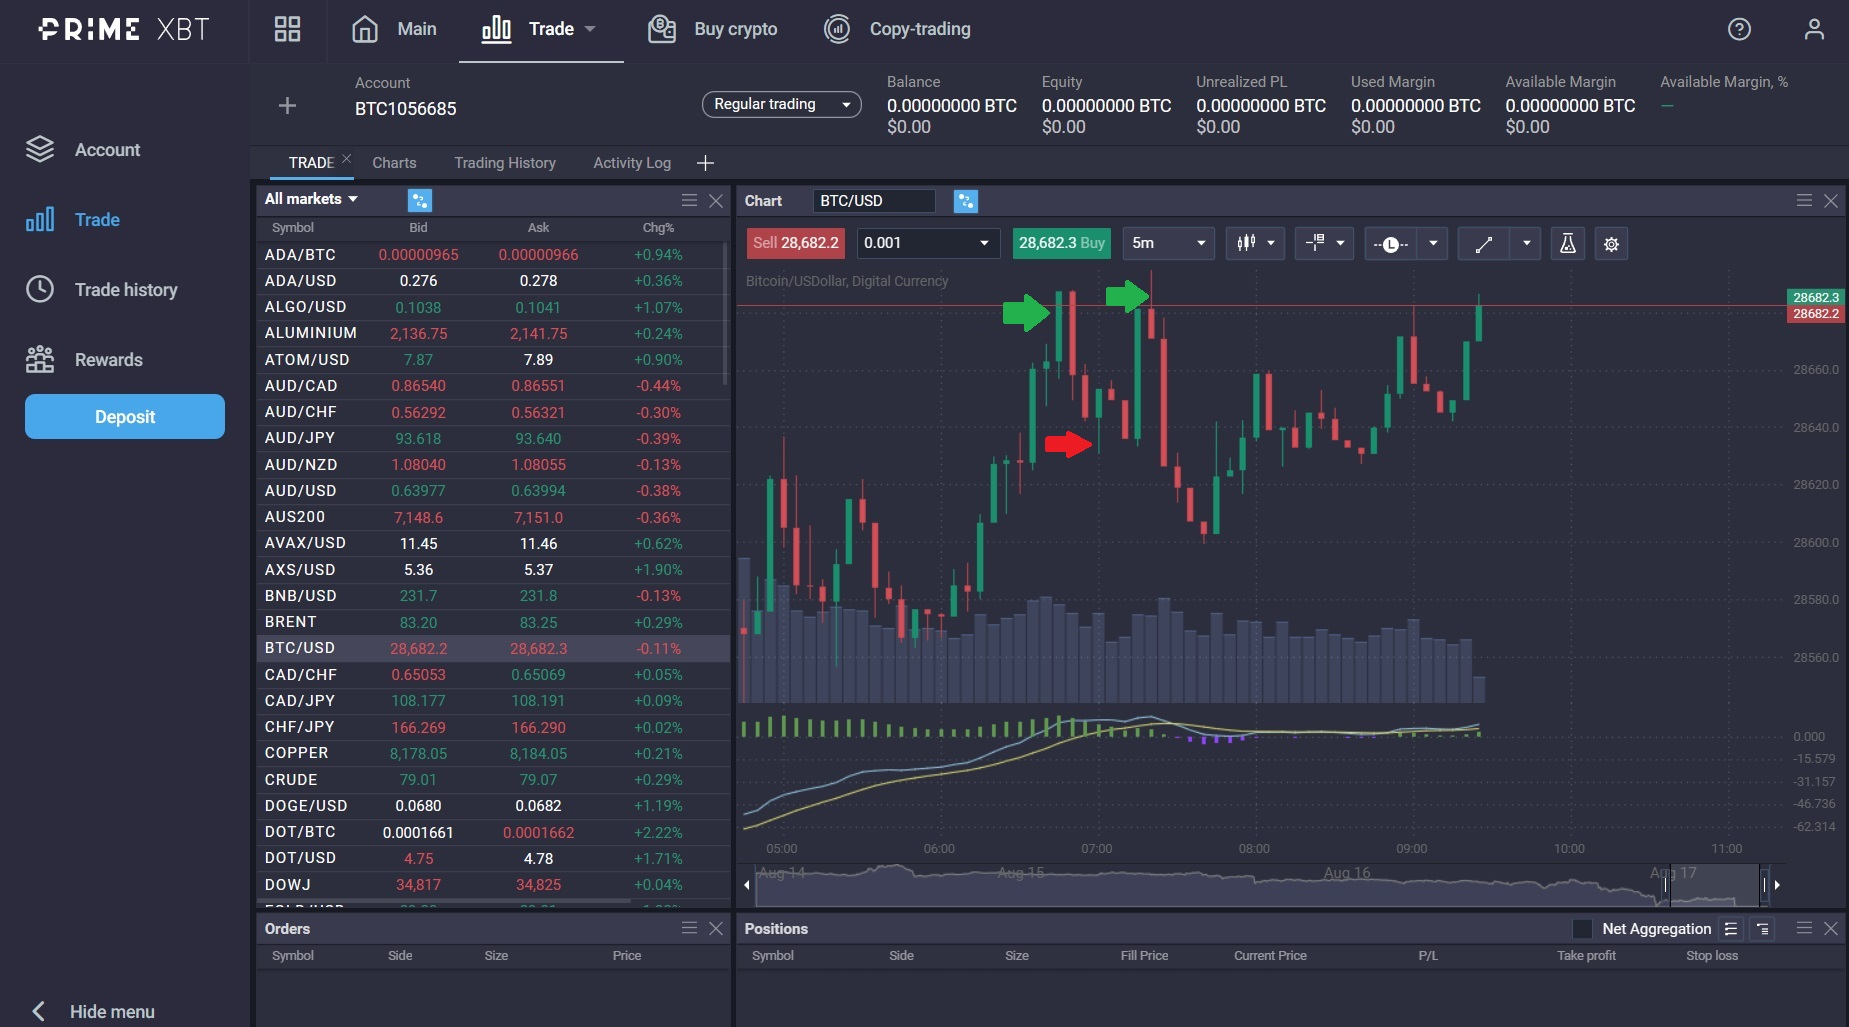
A double top chart pattern is defined by one peak that tests resistance, followed by a lower price that seems to test support, followed by a second peak that also seems to test resistance during a positive prior trend, as seen in the image below.
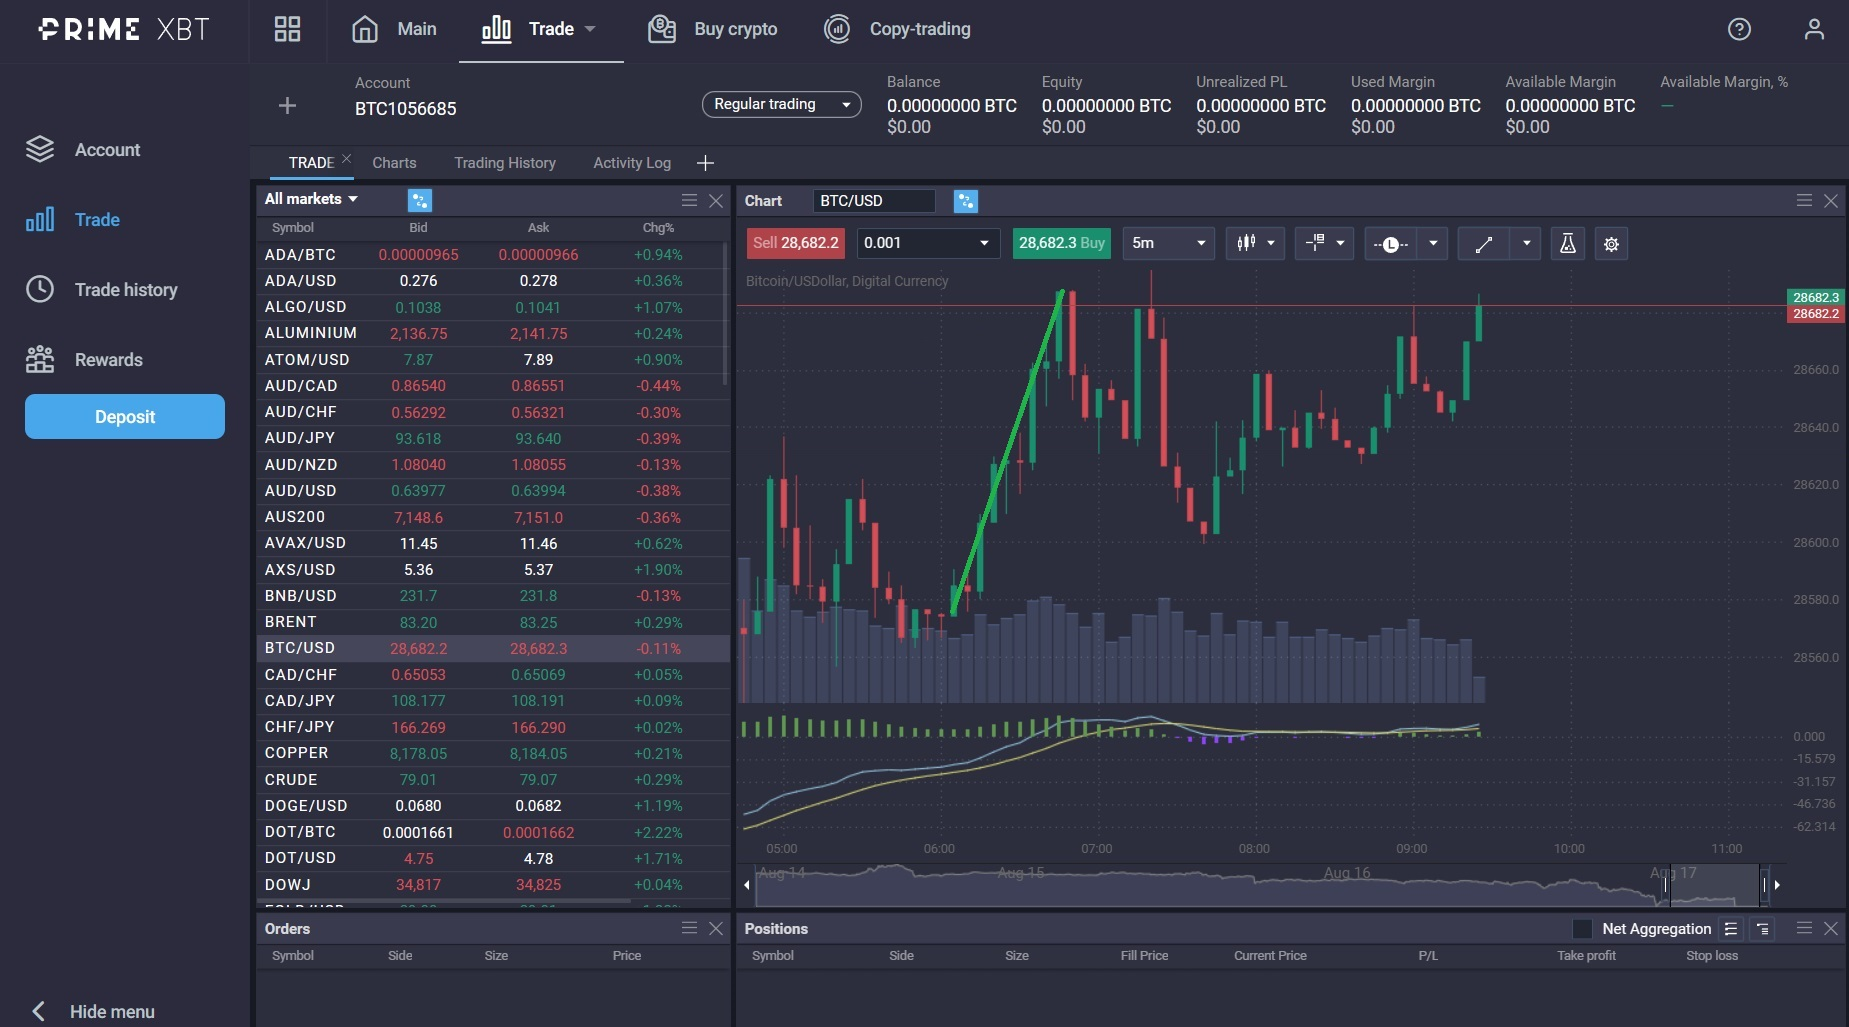
As the introduction mentions, a double top pattern is a bullish reversal pattern. This means that it happens when an asset increases in value; if the pattern is formed, it forecasts a drop in the asset’s value. In the image below, you can see the clearly defined uptrend denoted with a green line.
The magnitude of the drop is usually the same distance between the drop and the second peak. You’ll notice that the top red line and green line are support and resistance levels as the double top is developing.
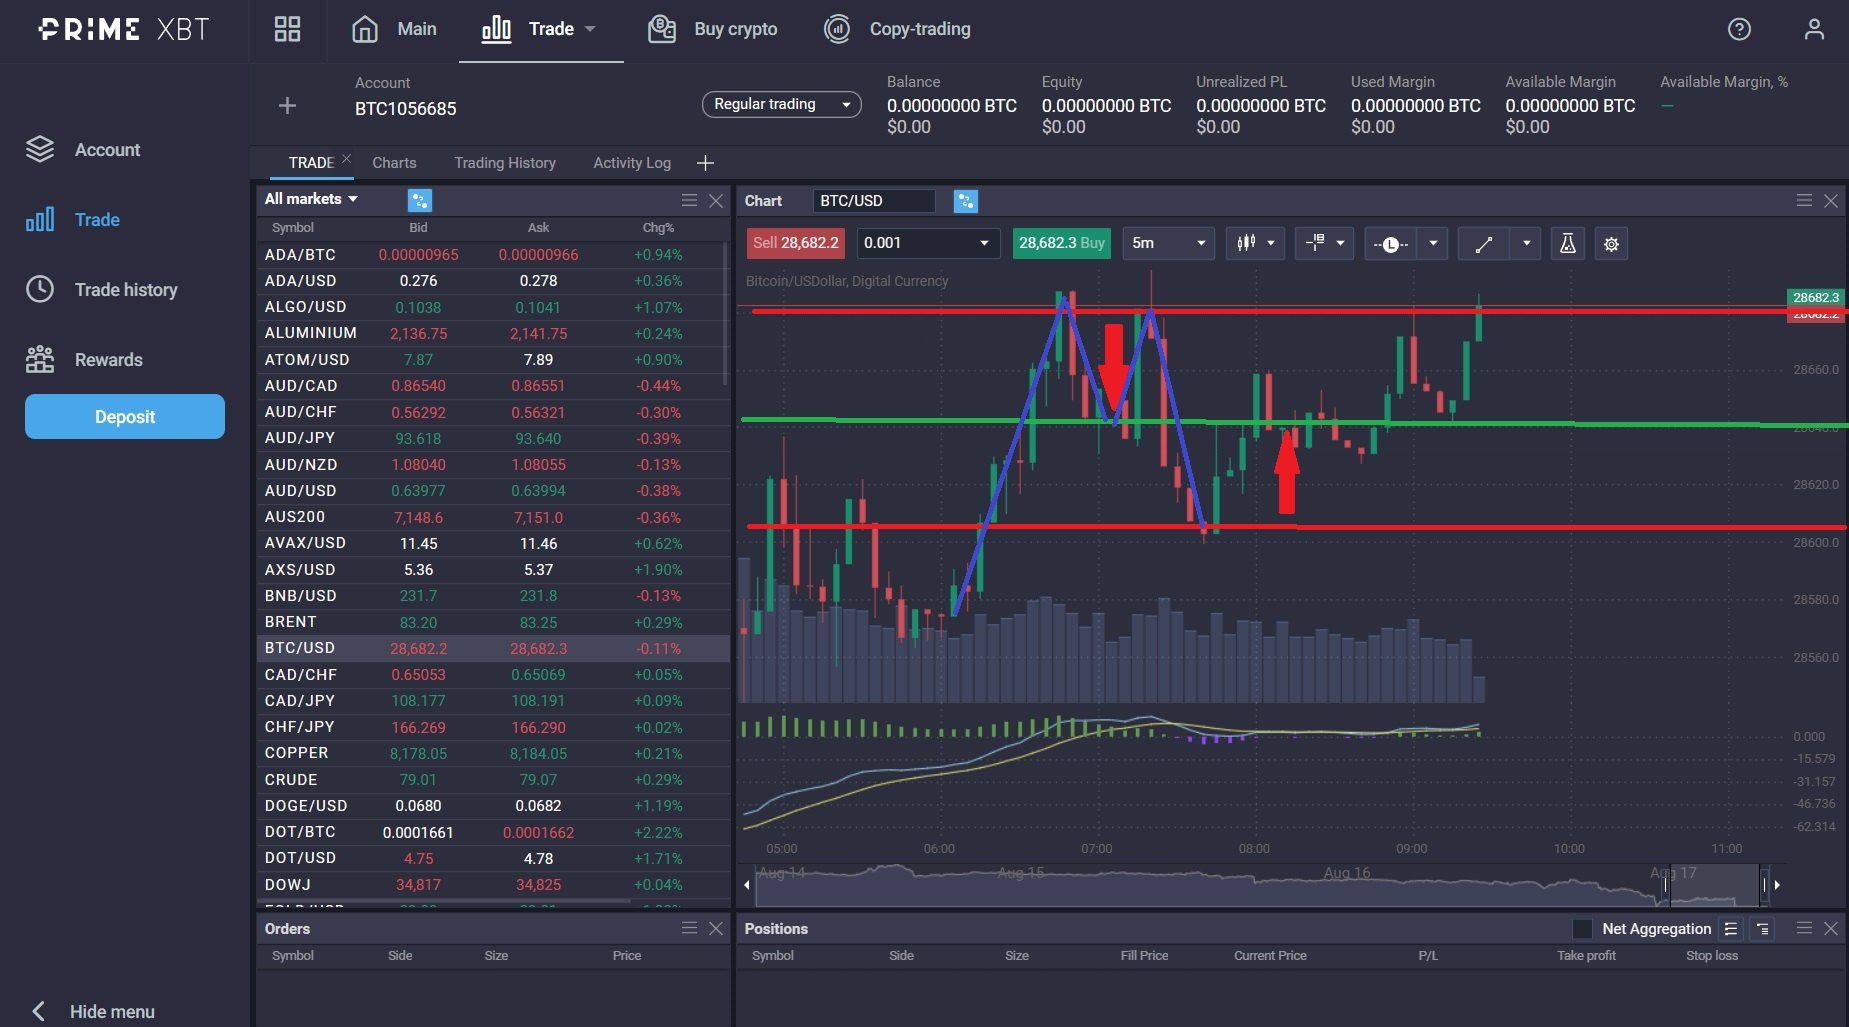
The green line which is also the previous support, is often referred to as a neckline, in case you encounter this terminology during your education or research.
Key Characteristics of the Double Top
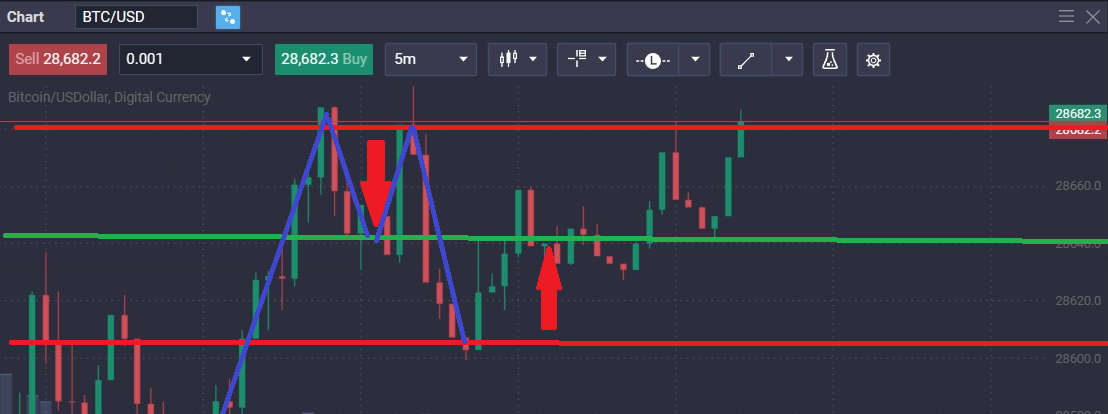
As mentioned above, a double top formation is always preceded by an uptrend. When the existing trend reverses, you will see broken support and a new support level being created. In most cases, you will also notice that the second peak of the chart pattern will be lower than the first peak due to an already-established resistance level.
Sometimes the downward trend continues, breaking the newly established support level. The trend reversal may happen again, though, resuming its upward trend.
Formation and Anatomy of the Double Top
Stages of Development
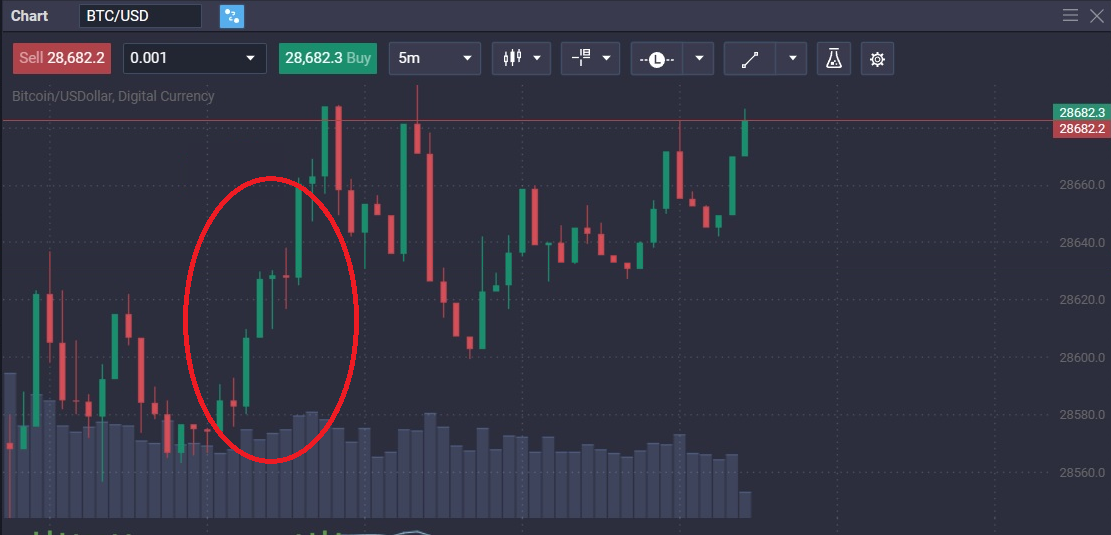
There are three distinct stages when a double top pattern develops. The first and probably most important is an obvious uptrend, as seen in the image above. As this chart pattern is a reversal pattern, there needs a trend to reverse!
The second phase of the pattern’s development is the first peak. You may see this test resistance multiple times before the price breaks downward.
The third phase is a momentary drop, which may also test support before it enters the last phase.
The final stage of the chart pattern is when it peaks for a second time and starts moving downward passing the newly established support. When the price breaks below the support established by the neckline (the dip between the two peaks) the pattern is completed.
This may be a misnomer; some consider the pattern completed when the price moves the same distance between the neckline to the second peak in the opposite direction.
Volume Analysis in Double Tops
The dynamics of this pattern are underpinned by trading volumes and market sentiment. As price breaks upwards, creating the first peak, many traders will sell off their assets for profit, weakening demand. This results in a moderate decline, causing other traders to purchase said asset. This, of course, causes the second (but lower) peak and, ultimately a trend reversal.
Interpreting and Trading the Double Top
Recognizing Confirmation Signals
Now that you know the basics of this pattern, how do you trade double tops? First, you need to monitor the market movement if it’s in an upward trend. Keeping a close eye on the markets is crucial when trading a double top reversal, as this pattern develops and completes very quickly compared to other patterns.
Once you see the two peaks and moderate trough in between, the pattern is confirmed, and a potential trend reversal is close, you can act.
Strategic Entry and Exit Points
If you are short trading an asset, ideally, you would like to enter a trade at the highest point you can during a prevailing trend and exit before it ends. As stated in other articles, “Do not try to catch a falling knife”, make sure you can see the actual pattern, allowing yourself enough margin of safety in case it is a failed double.
Taking the appropriate measures to minimise the risks involved when you trade double tops will ensure you maximise your return, while protecting your account.
Setting Stop-Losses and Target Prices
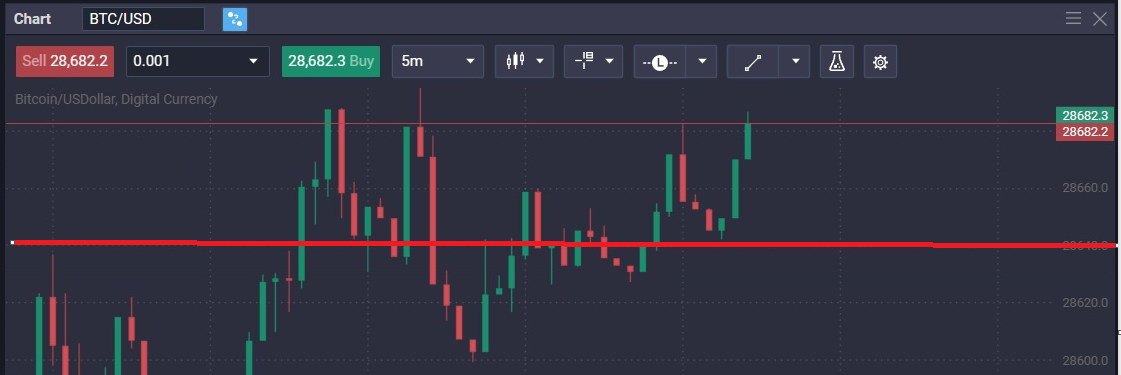
A great risk management method to protect your account while still taking full advantage of the double top is by setting up stop-loss. If you are unfamiliar with the term, a so-called limit order closes your trade in case the double top is false, and the market moves against your position.
Stop loss is a double-edged sword; if you are too conservative and set it too close to the current price, a small climb might cause your position to close, minimising your trade’s profit potential. Setting it too far away from the current price level and your losses may surpass your risk appetite.
With double top, in very broad strokes, you can set your stop loss just below the previous support level, which is the neckline and where you would open your trade.
Common Mistakes and Misinterpretations
Although double tops are easy to recognise, they are also frequently misinterpreted because traders do not wait for the pattern to develop and be confirmed, trying to get the maximum return on their investment.
Unfortunately, many patterns start with a peak, like the head and shoulders pattern, which can cause high losses since a head and shoulders pattern, is created by a peak, a dip, a higher peak, a dip a final lower peak and a trend reversal.
During the second higher peak, your trade will close if you set your stop loss at the neckline – which is the best-case scenario. If you go short without stop loss, on the other hand, your losses can quickly multiply as the price rises to the second peak.
Double Top Vs. Similar Patterns
Distinguishing from the Double Bottom
Double top formations create an “M” shape that only happens during a bullish trend, yielding a bearish signal. A double bottom pattern, on the other hand, is the exact opposite. The double bottom creates a “W” during a bearish trend, yielding a bullish signal.
Other Reversal Patterns to Watch
There are many different reversal patterns, depending on the market’s overall trend, and some traders use other technical indicators in conjunction to confirm these like the ascending triangle and the symmetrical triangle. Of course this requires more time and knowledge to plot out and execute successfully.
But few, if any, of these patterns and indicators are as easy and straightforward to use as the double top pattern.
Conclusion: The Double Top’s Place in a Trader’s Arsenal
If you are a trader or investor looking for an effective way to analyse markets without complex indicators, calculations and research, then the double top pattern, might be the perfect solution for you.
What is the rule for double top pattern?
It is always formed during a bullish trend and gives a bearish signal.
What will happen after double top pattern?
The trend will go from bullish to bearish i.e. it will go from going up in to going down.
Is double top pattern bullish?
No the double top pattern is bearish.
Is the double top pattern accurate?
This depends on multiple factors and variables, but is as accurate if not more than any other chart pattern or technical indicator.
The content provided here is for informational purposes only. It is not intended as personal investment advice and does not constitute a solicitation or invitation to engage in any financial transactions, investments, or related activities. Past performance is not a reliable indicator of future results.
The financial products offered by the Company are complex and come with a high risk of losing money rapidly due to leverage. These products may not be suitable for all investors. Before engaging, you should consider whether you understand how these leveraged products work and whether you can afford the high risk of losing your money.
The Company does not accept clients from the Restricted Jurisdictions as indicated in our website/ T&C. Some services or products may not be available in your jurisdiction.
The applicable legal entity and its respective products and services depend on the client’s country of residence and the entity with which the client has established a contractual relationship during registration.


