Markets remain in a fragile state following Monday’s sharp moves, and today we’re continuing our focus on the S&P 500 and Bitcoin—two key assets sitting at major technical crossroads. In this update, we’ll revisit the levels discussed in yesterday’s report and assess how price has reacted since then. We’re also expanding today’s analysis by adding a look at Gold, which is gaining attention as global uncertainty lingers.

S&P 500 (SPX)
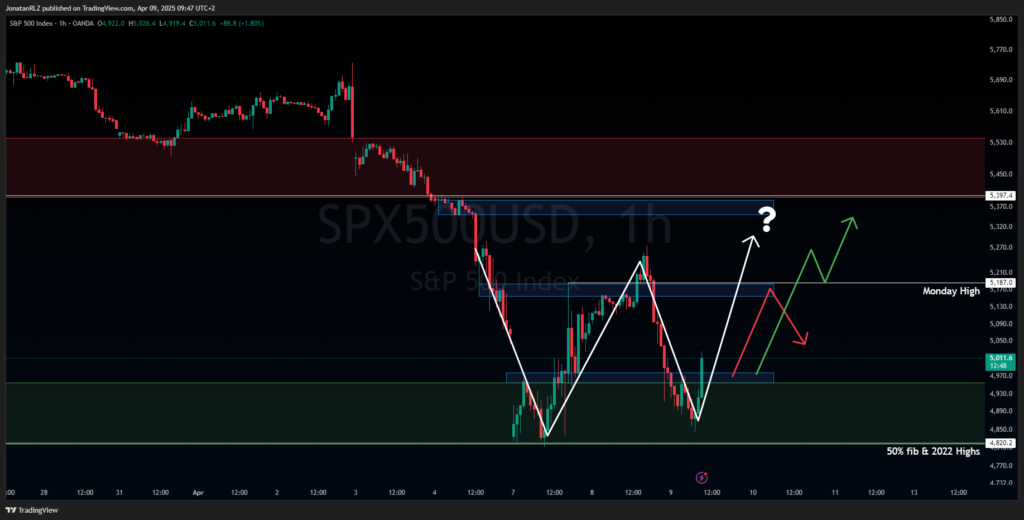
After a brief show of strength yesterday, the S&P 500 reclaimed the Monday highs—but only temporarily. Price failed to hold above that level and reversed sharply, falling back below 5,000 and into the key zone discussed in yesterday’s report. This area aligns with the 2022 highs and marks a notable support level that emerged during Monday’s opening gap.
We’re now seeing early signs of a potential double bottom formation at this level. The key question is whether this could represent the start of a broader recovery—or just a pause before further downside.
A failure to reclaim the Monday highs again would invalidate the developing W-structure and could leave the market exposed to additional weakness. On the other hand, a clean reclaim or break-and-retest of that level may signal short-term strength and confirm the neckline of the W-pattern, potentially opening the door to a larger bounce.
As outlined in yesterday’s macro analysis, the S&P 500 would still need to reclaim lost high timeframe structure in the $5,600–$5,800 area to re-establish a more constructive macro bias. That’s a considerable move—about 15% above current levels—but could become more realistic if this support holds and momentum begins to shift.

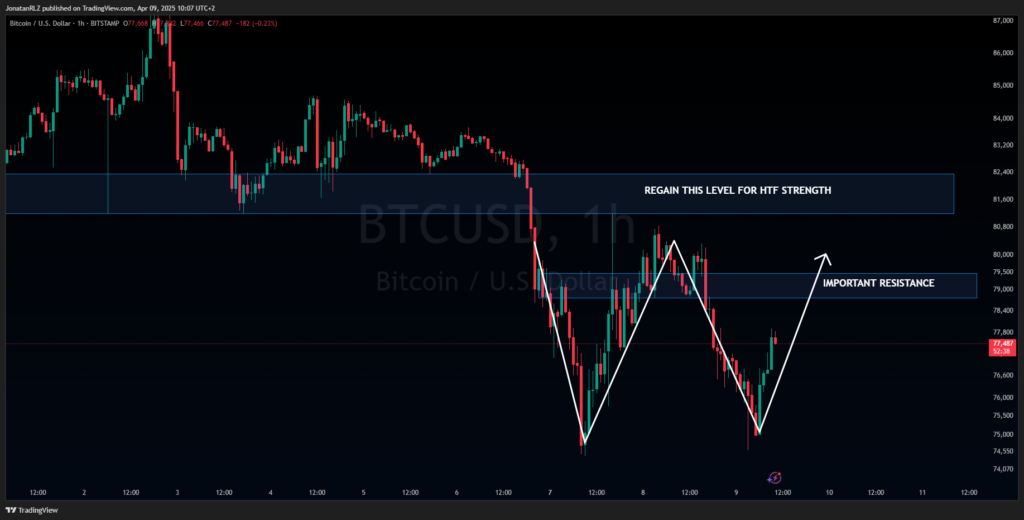
Bitcoin (BTC/USD) Bitcoin is exhibiting a very similar technical structure to the S&P 500, with a classic double bottom—or W-pattern—potentially forming. What makes Bitcoin’s setup particularly notable is the relative strength it continues to show compared to traditional equities.
While the S&P 500 would require a roughly 15% rally to retake high timeframe structure, Bitcoin would only need to advance about 5–8% from current levels. A reclaim of the $82,000 area would suggest improving bullish momentum and could mark an important shift in structure.
Interestingly, while the S&P is printing its W-pattern well below high timeframe resistance, Bitcoin is doing so just beneath its own HTF resistance zone. This proximity may allow that resistance to serve as a possible neckline, adding confluence to any potential breakout if it occurs.
That said, Bitcoin is still a risk asset, and its movements often correlate with equity market sentiment. Even if Bitcoin confirms the pattern by reclaiming $82K, it’s worth monitoring the S&P 500 closely—especially if it remains under key resistance.
The current relative strength in Bitcoin stands out, but whether it can decouple meaningfully from traditional markets remains uncertain. So far, correlation has persisted, but that relationship can evolve over time.
Make sure to revisit yesterday’s report for a closer look at Bitcoin’s broader structure and the key high timeframe levels currently in play.

Gold (XAU/USD)
Turning to gold, which has enjoyed a strong bull market over the past several years, the question now is whether that strength can persist as global conditions shift. Recent tariff-related headlines and broader concerns over trade tensions have led some analysts to suggest we may be entering a new market cycle.
Will gold continue acting as a safe haven during periods of uncertainty? Or could the shifting macro landscape begin to challenge that narrative?
While these are complex questions with no certain answers, technical analysis gives us a framework for navigating the chart.
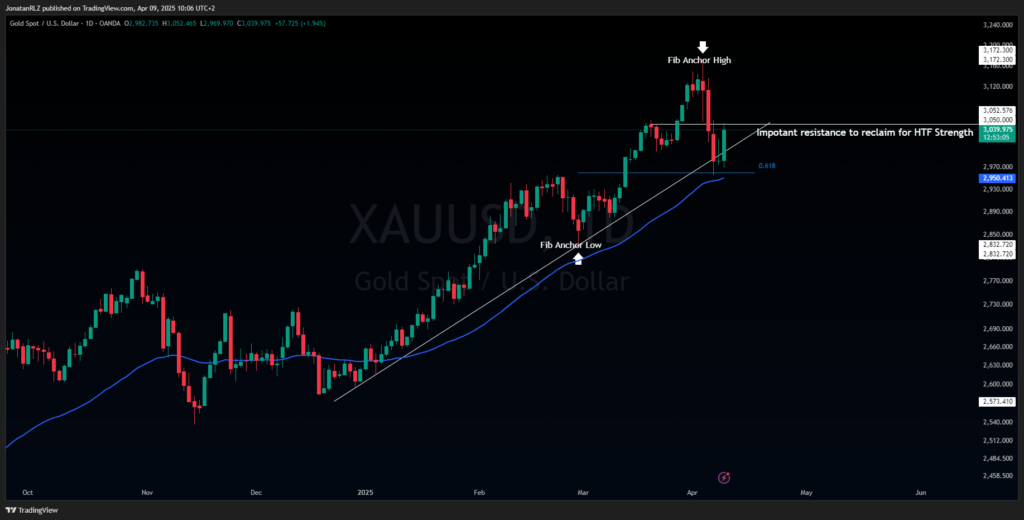
Gold remains in what can arguably still be considered a high timeframe uptrend, despite a recent breakdown below support. Price has now reached a confluence zone around $2,950, where the 0.618 Fibonacci retracement and previous HTF support levels intersect. This area also aligns with the daily 50 EMA, providing multiple technical layers of potential support.
Above, we have the $3,050 resistance level—a key zone that, if reclaimed, could suggest bullish momentum is rebuilding. Failure to reclaim this level, however, may indicate that the long-standing uptrend has weakened, at least for now.
So the central question becomes: Is this bounce simply a short-term reaction, or the beginning of a new trend?
We’ll explore that more closely in tomorrow’s update as we look at gold’s intraday structure. We’ll also be adding analysis on EUR/USD, so make sure to check back for that.
Thanks for reading—see you in the next update.
The content provided here is for informational purposes only. It is not intended as personal investment advice and does not constitute a solicitation or invitation to engage in any financial transactions, investments, or related activities. Past performance is not a reliable indicator of future results.
The financial products offered by the Company are complex and come with a high risk of losing money rapidly due to leverage. These products may not be suitable for all investors. Before engaging, you should consider whether you understand how these leveraged products work and whether you can afford the high risk of losing your money.
The Company does not accept clients from the Restricted Jurisdictions as indicated in our website/ T&C. Some services or products may not be available in your jurisdiction.
The applicable legal entity and its respective products and services depend on the client’s country of residence and the entity with which the client has established a contractual relationship during registration.


