S&P 500: Bulls Fighting Back After Indecision Candle
Welcome back, everyone, to today’s technical update on the S&P 500.
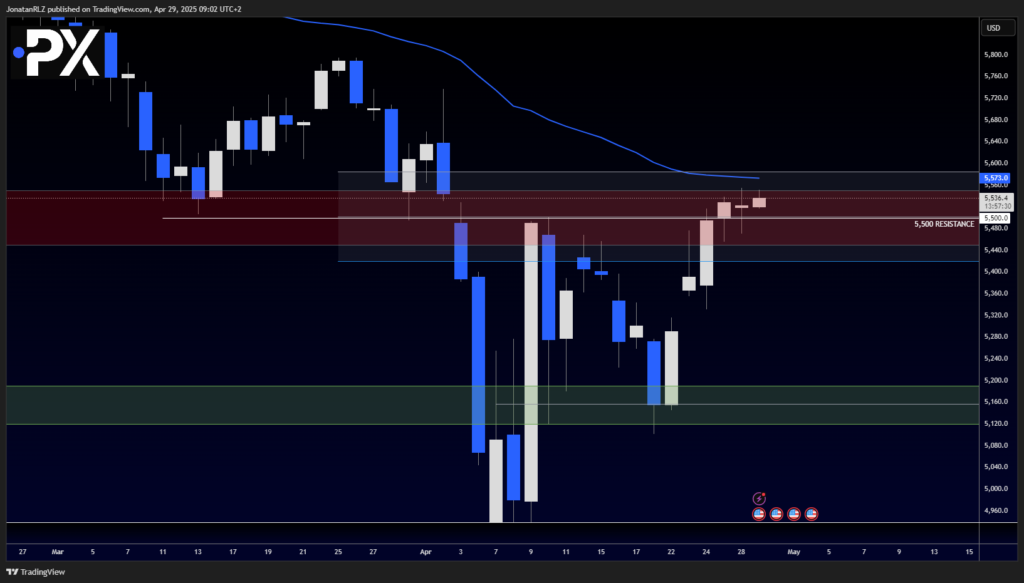
We begin by looking at the daily timeframe, and what we can see is that yesterday’s daily candle closed as an indecision candle—a classic spinning top.
This type of candle signals uncertainty between bulls and bears, and its significance grows when it prints at a major support or resistance zone.
At resistance, a spinning top can sometimes act as a warning for a potential reversal.
However, watching today’s early session, bulls have stepped back in, and the current daily candle is showing strong upside momentum at the time of writing.
This suggests that buyers are not yet ready to give up control, despite the earlier hesitation near this important resistance zone.
It’s also important to keep in mind that even if we see a breakout on the lower timeframes, there is major confluence resistance slightly above.
Specifically:
- The 0.786 Fibonacci retracement level,
- The daily 50 EMA, and
- The weekly 50 EMA all cluster together just above the current price, adding extra weight to the resistance zone.
This confluence zone could act as a strong barrier, even if we get short-term bullish momentum on lower timeframes.
Let’s now zoom into the lower timeframes to look for breakout structures, intraday ranges, and critical levels to watch.

4H Chart – Broadening Pattern Forms as Bulls and Bears Battle for Control
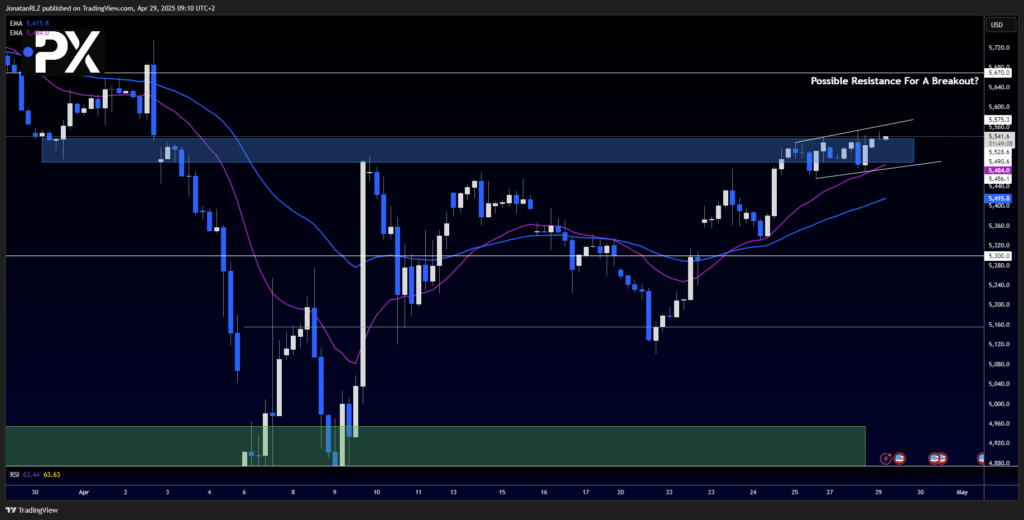
Moving into the 4-hour timeframe, we can see that price is currently testing a local resistance area.
At the same time, the 20 EMA (purple) has now crossed above the 50 EMA (blue), giving the short-term trend a fairly bullish structure.
However, it’s important to note that price is forming a broadening wedge, also known as a megaphone pattern, right at resistance.
This pattern was also visible on Bitcoin yesterday, and as explained in that update, it represents growing indecision between buyers and sellers.
In a broadening wedge:
- Both bulls and bears are fighting for control,
- Volatility expands over time, with wider and wider swings,
- And eventually, one side wins, leading to a decisive breakout or breakdown.
For now, we are watching:
- The lower ascending trendline as support, and
- The upper ascending trendline as resistance.
Key Levels to Watch:
- A breakout above the upper trendline could trigger a move toward the 5,670 resistance area.
- A breakdown below the lower trendline could shift momentum sharply toward the 5,300 support zone.
With the broader market structure still at a critical zone, how price resolves this pattern could set the tone for the next major move.

1H Chart – Rising Wedge Invalidated, Broadening Pattern Takes Over
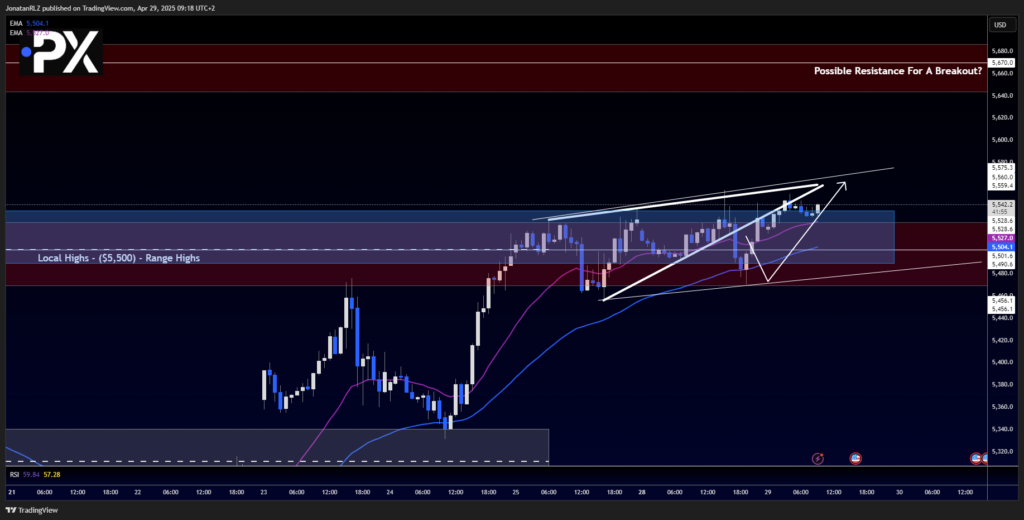
Zooming into the 1-hour chart, we’re revisiting the structure discussed in yesterday’s update where we highlighted the rising wedge formation.
We did initially get a break to the downside out of the rising wedge, but as you can see, that breakdown turned into a fakeout.
Price quickly recovered, invalidating the rising wedge pattern.
Interestingly, the break below the rising wedge also created the lower trendline now being used as part of the broadening wedge pattern—meaning both structures are visible on this chart today.
It’s also worth noting that during the breakdown, the 1-hour 50 EMA (marked as the blue moving average) acted as strong support, helping stabilize price before the bounce back.
This reaction to the moving average is important for future monitoring:
- Moving averages like the 50 EMA can often act as dynamic support or resistance, especially during pattern breakouts or fakeouts.
- Watching how price interacts with these levels during breakout attempts can provide additional confirmation or early warning signs of failure.
In the current environment, the broadening wedge boundaries and the behavior around the 50 EMA will remain key tools for gauging strength or weakness in today’s trading session.

The content provided here is for informational purposes only. It is not intended as personal investment advice and does not constitute a solicitation or invitation to engage in any financial transactions, investments, or related activities. Past performance is not a reliable indicator of future results.
The financial products offered by the Company are complex and come with a high risk of losing money rapidly due to leverage. These products may not be suitable for all investors. Before engaging, you should consider whether you understand how these leveraged products work and whether you can afford the high risk of losing your money.
The Company does not accept clients from the Restricted Jurisdictions as indicated in our website/ T&C. Some services or products may not be available in your jurisdiction.
The applicable legal entity and its respective products and services depend on the client’s country of residence and the entity with which the client has established a contractual relationship during registration.


