Welcome back, everyone, to another technical update on the S&P 500.
Momentum continues to shift in favor of the bulls, with price pushing higher in yesterday’s session and starting to press against a cluster of key technical levels.
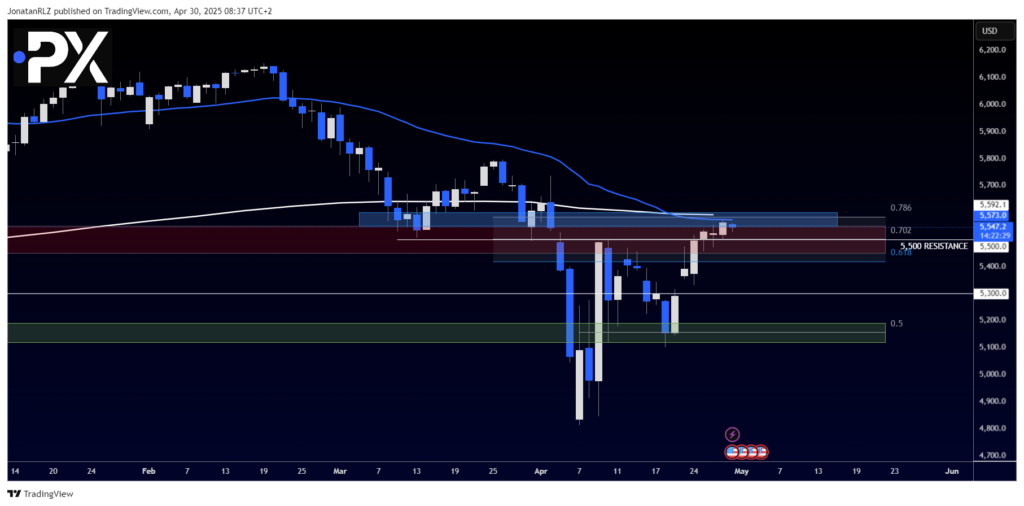
As shown on the chart:
- The daily 50 EMA is marked in blue
- The weekly 50 EMA is marked in white
These two moving averages are now stacked closely together, creating a clear confluence zone of resistance just above current price. This area also aligns with the 0.786 Fibonacci retracement, reinforcing the technical importance of the $5,550–$5,600 region.
In response to this, a new level has been marked on the chart—highlighted in blue—representing this newly defined resistance zone.
With that level established, the previous resistance around $5,500 now becomes an important support area to monitor on any pullback.
If price manages to hold above $5,500 and eventually break above $5,600, this would confirm a decisive shift in trend structure, opening the door for further upside.
This area—where the daily and weekly 50 EMAs converge—is now the key battleground for bulls. A sustained breakout above this zone could shift sentiment across the broader market.

4H Chart – Broadening Pattern Holds as Key Data Looms
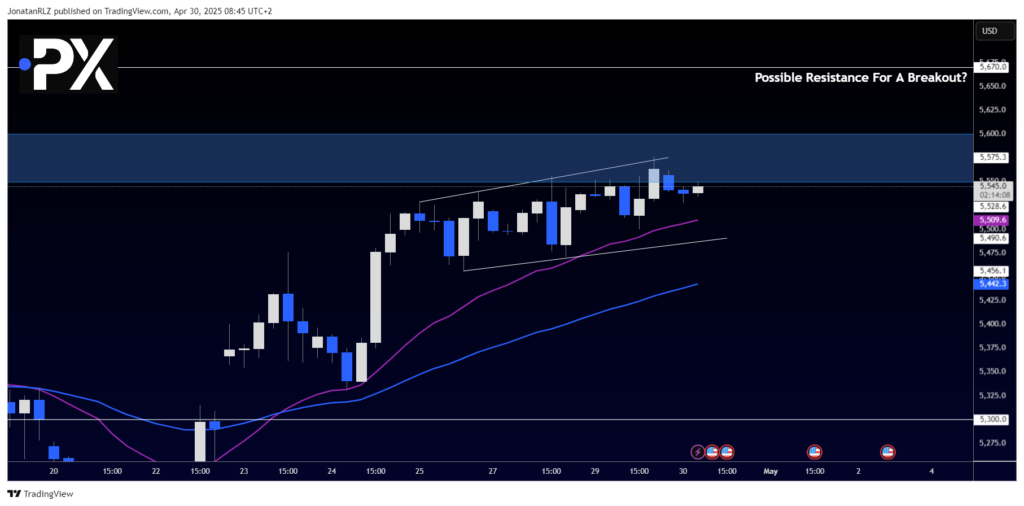
Zooming into the 4-hour chart, the broadening pattern—also referred to as a broadening wedge or megaphone pattern—is still intact and actively shaping price action.
The upper trendline of the pattern continues to act as the most important resistance level in this timeframe, and price remains coiled just beneath it.
We’ve also marked a new resistance area in blue, spanning roughly between $5,550 and $5,600, which is now clearly acting as the top of the current range. A breakout here could initiate the next leg higher.
Looking at momentum, bulls still appear to be in control, but we’re likely going to need a clear catalyst to either break above this resistance or roll back into the previous range.
If price breaks out above $5,600, the next upside target could be the $5,670 zone, previously identified as a breakout resistance level.
On the other hand, if we see a pullback, a move below $5,500 would likely send us back into the prior range, reintroducing the more neutral short-term structure.
Key macro catalysts to watch today include:
- U.S. GDP Growth Rate
- Personal Income & Spending data
- Core PCE Price Index
These data points could be just what the market needs to break out of this structure—in either direction.
We’ll be tracking the reaction closely.

Open free account
Your capital is at risk.
The content provided here is for informational purposes only. It is not intended as personal investment advice and does not constitute a solicitation or invitation to engage in any financial transactions, investments, or related activities. Past performance is not a reliable indicator of future results.
The financial products offered by the Company are complex and come with a high risk of losing money rapidly due to leverage. These products may not be suitable for all investors. Before engaging, you should consider whether you understand how these leveraged products work and whether you can afford the high risk of losing your money.
The Company does not accept clients from the Restricted Jurisdictions as indicated in our website/ T&C. Some services or products may not be available in your jurisdiction.
The applicable legal entity and its respective products and services depend on the client’s country of residence and the entity with which the client has established a contractual relationship during registration.


