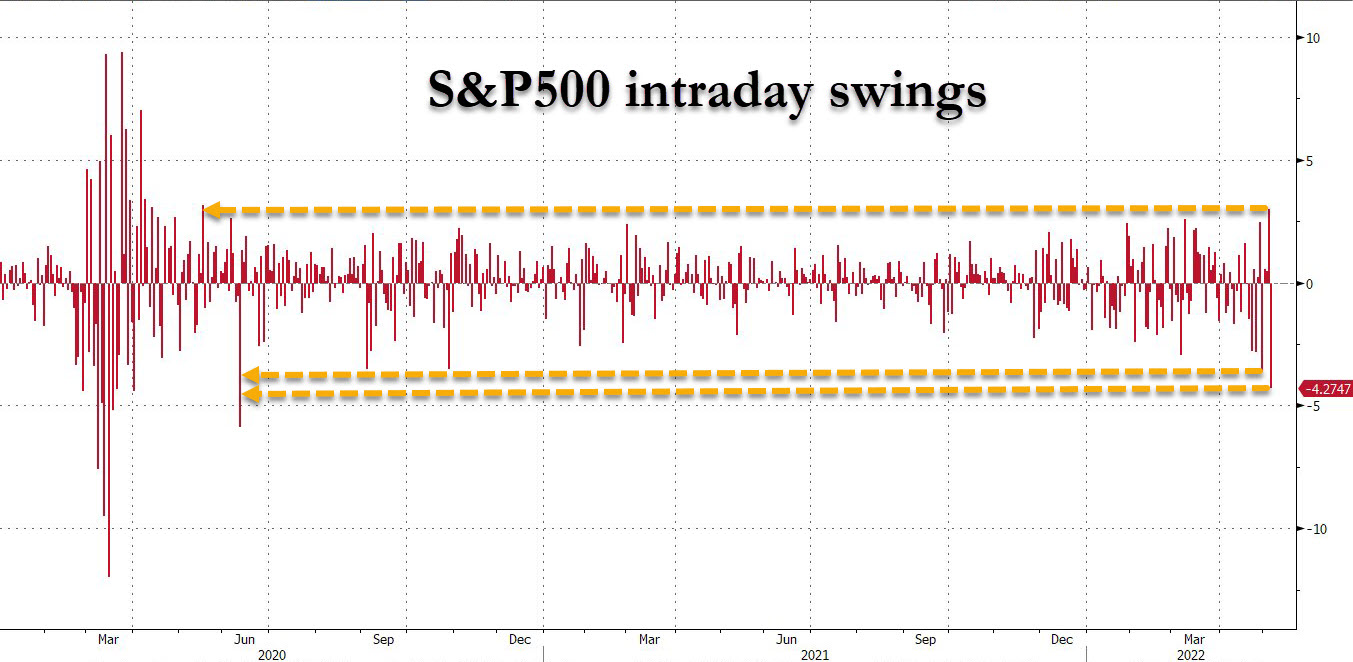
Last week, US stocks had one of the highest intra-day volatilities since the COVID crash of 2020. Prices swung wildly between positive and negative territory as investors pondered over the latest Fed meeting takeaway, as well as economic data.
As already widely expected, the Fed raised the benchmark interest rate by 50-bps on Wednesday. In addition, the central bank outlined a program in which it will eventually reduce its bond holdings by $95 billion a month.
While the 50-bps rate move is the largest in 22 years and is in response to burgeoning inflation pressures, Fed Chair Powell spoke against more aggressive measures like hiking 75-bps at a time, which calmed the markets. With the ADP employment figure released on Wednesday below estimates, traders betted that the Fed may not raise rates in the June and July meetings and the markets stormed higher on Wednesday, only to reverse all the gains plus more on Thursday.
This reversal gave the US stock markets two biggest record since mid-2020. While Wednesday saw the biggest surge since May 2020, Thursday played out the biggest drop since June 2020.
After the release of April’s non-farm employment number on Friday, the markets finally calmed down a little as the jobs picture continues to show improvement. Payroll growth accelerated by 428,000 in April, more than the expected 400,000, which gave investors a bit of a solace over fears of stagflation.
For the week, the Dow finished down 0.24% for its sixth consecutive negative week. The S&P and Nasdaq finished with losses of 0.21% and 1.54%, respectively, for their fifth straight losing week.
The yield on the benchmark 10-year Treasury note rose to 3.146% at one point, its highest level since 2018, before finishing the week a tad lower at 3.124%. This led the USD stronger all week, with the DXY closing at the high of the week of 103.55 after a brief fall on Wednesday.
Even though the USD was King, Gold and Silver managed to finally stem their huge falls in April, with Gold having lost a mere 1% and Silver drifting down 2.18% last week.
However, as US stock futures opened the new week sliding lower again, the flight to the USD has resumed as the price of Gold and Silver lost another 0.5% at the start of the new week.
Oil though, bucked the strong USD trend once again and surged higher following the approval of EU’s Russian Oil ban. Traders shrugged off worries about the prospect of slowing economies to bid the WTI Crude higher by about 5% while Brent rose nearly 4% last week, but are opening the new week also around 0.5% weaker.
The US was not the only country to have hiked rates last week as many other economies are on a rush to raise interest rates to stem out surging inflation.
Earn on a falling market
Other Rate Hikes Last Week
Australia’s central bank, on Tuesday, in a contrary move to its statement to remain patient two months ago, unexpectedly raised the cash rate by 25-basis points to 0.35%, defying expectations for a hike of only a 15-basis points. This caused bond yields to rise, and Aussie stocks slumped. As a result, the AUD/USD rebounded after having fallen for a month.
The RBI, on Wednesday, raised its key lending rate by 40-basis points to 4.40% with immediate effect. The central bank also hiked the cash reserve ratio by 50-basis points. The decision was taken by the monetary policy committee (MPC) in an off-cycle meeting with the central board held May 2-4.
The BOE on Thursday raised interest rates to their highest level in 13 years in a bid to tackle soaring inflation in the UK. The policy board rose interest rate by 25-bps for the fourth time in a row, taking the base interest rate up to 1%, while admitting that it would have preferred to rise it by 50-bps. This statement hinted to investors that more hikes would be on the way as it sees inflation surging to 10%.
Crypto Slumps On The Back Of Stock Selloff
As stocks cracked under immense selling pressure in the aftermath of the Fed meeting, cryptocurrencies also slumped as BTC fell more than 12% on the week. The rest of the crypto market saw a renewed bloodbath after only half a day of reprieve on Wednesday when BTC bounced to $40,000 before sellers quickly emerged early Thursday even before the US stock market opened.
As excited traders began to pile in on long positions after the stock market rose significantly on Wednesday post Fed meeting, the funding rate on BTC futures surged to an unsustainable level at the same time, showing that a huge number of long positions were being opened.
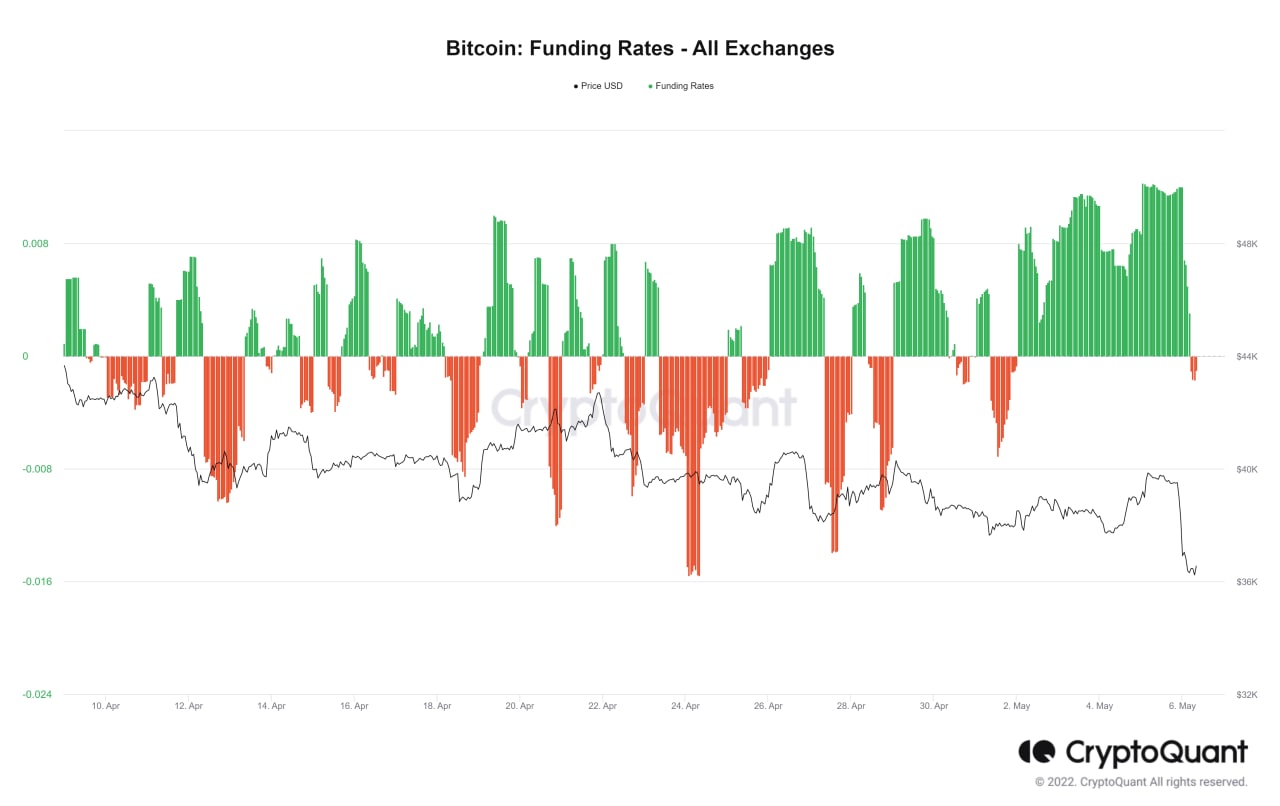
Sudden surges in funding rate never ends well and indeed, within 24-hours, the new positions were wiped out as price came crashing down on Thursday.
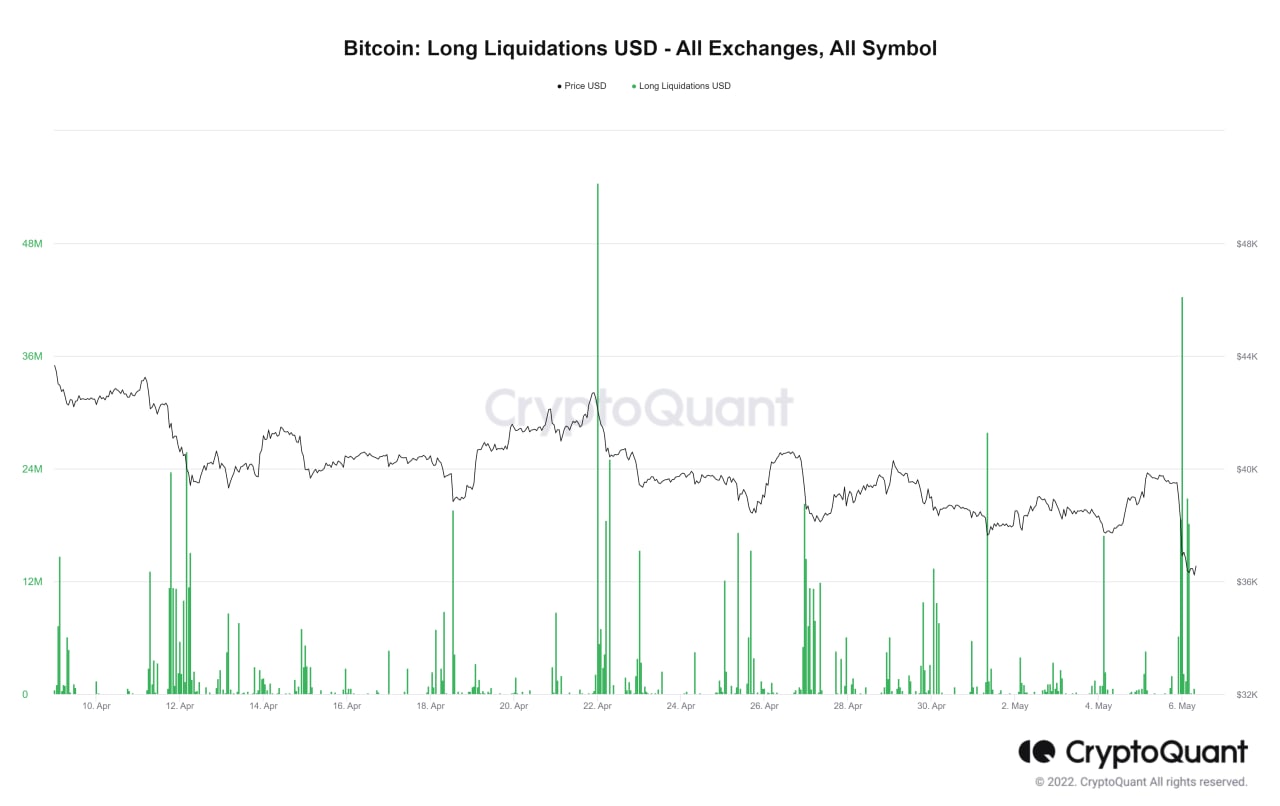
In the 24-hours post Fed decision, all markets, including crypto, saw a huge spike in volatility as bulls and bears battled it out. On Thursday, as the Nasdaq crashed, BTC dipped more than 9% as well, liquidating more than $100 million in crypto long positions within just one hour of the stock market opening, with around half of it attributed to BTC alone.
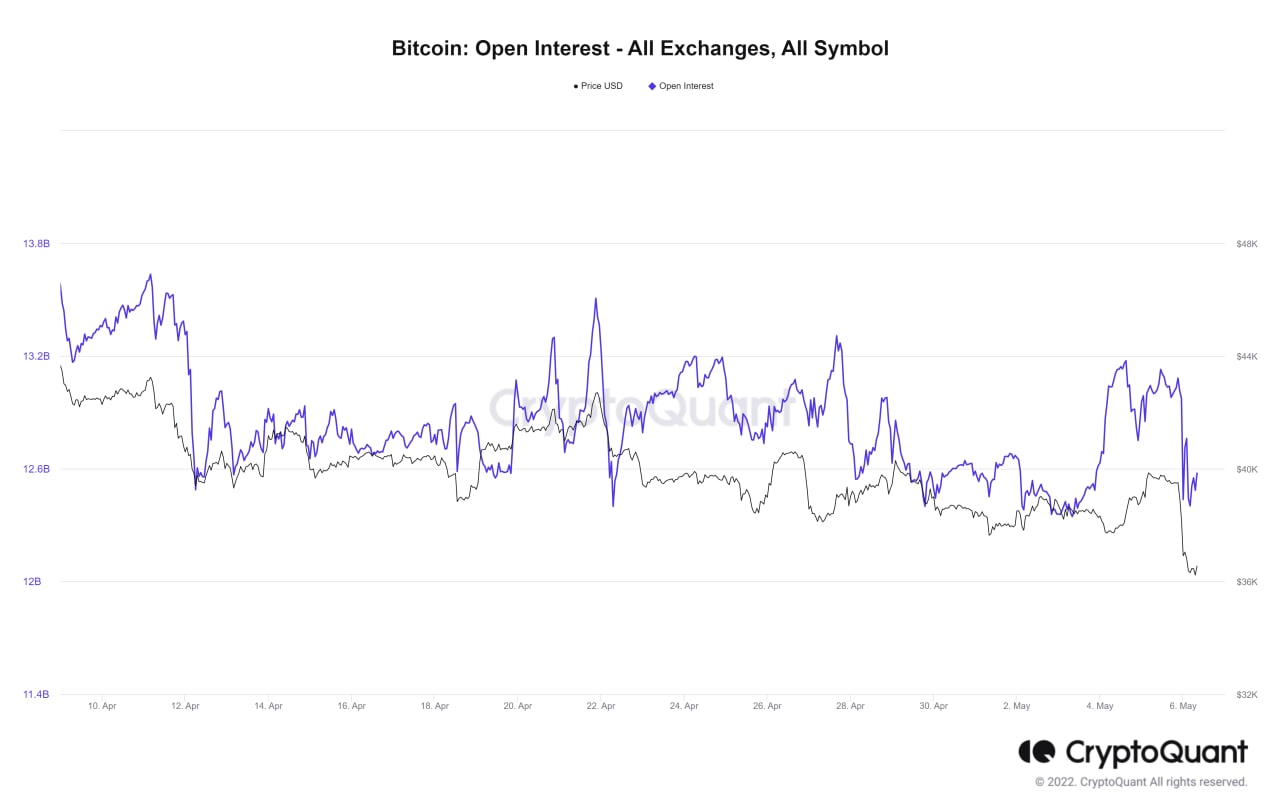
The pullback sent Open Interest in the Futures markets down more than $600 million by the end of Thursday as an equal amount of long positions got liquidated in 24-hours, which brought the amount of BTC Open Interest back down to equilibrium.
BTC Hashrate Hits ATH Even As Price Retreats
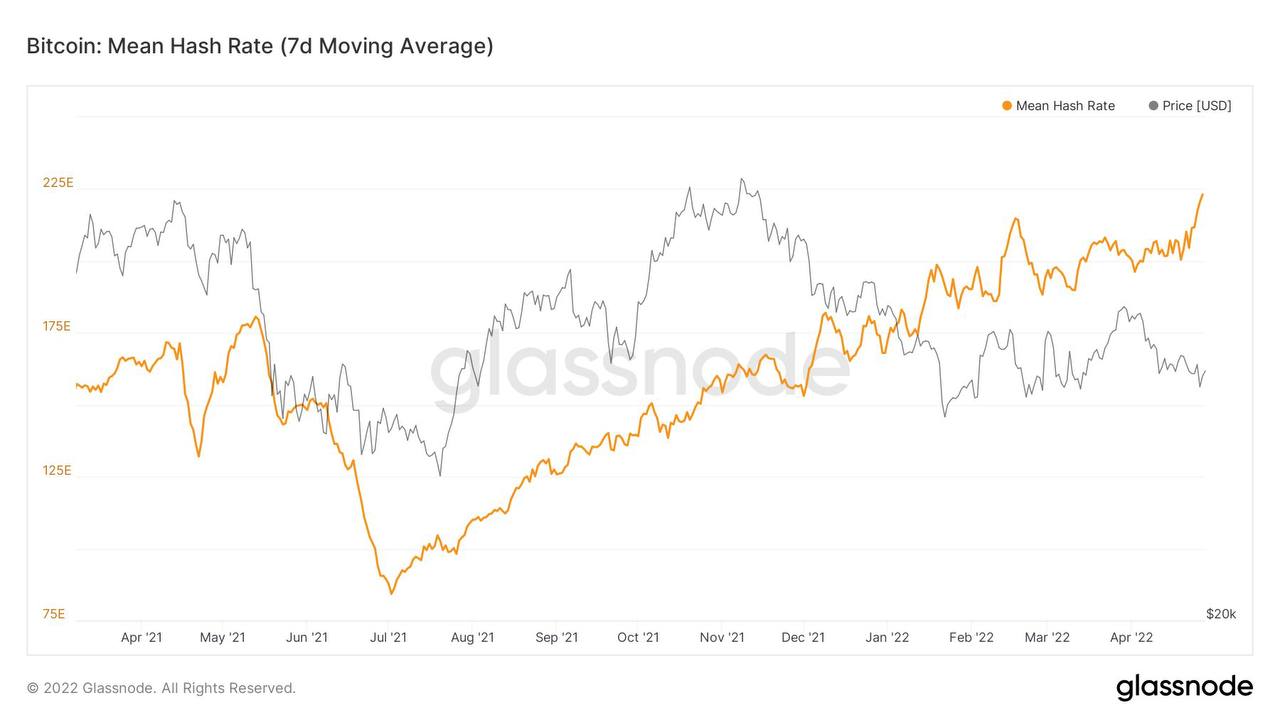
While short-term trading positions are negatively impacted by the falling stock market, fundamentals of BTC continues to improve. One such fundamental is the hashrate, which is an important determinant of network security. Although price has come off rather significantly, the hashrate of BTC continues to edge higher, and even hit yet another ATH last week.
As price eventually catches up with the improving fundamentals, it is a matter of time when the price of BTC gets out of its current doldrums.
Buy The Dip
BTC Exchange Withdrawal Hits 3-Month High
An interesting event last week was that the Luna Foundation acquired 37,863 more BTC worth $1.5 billion over two transactions. The first involved a $1 billion UST for BTC swap with prime broker Genesis Trading, while the second was a purchase worth around $500 million from crypto hedge fund Three Arrows Capital.
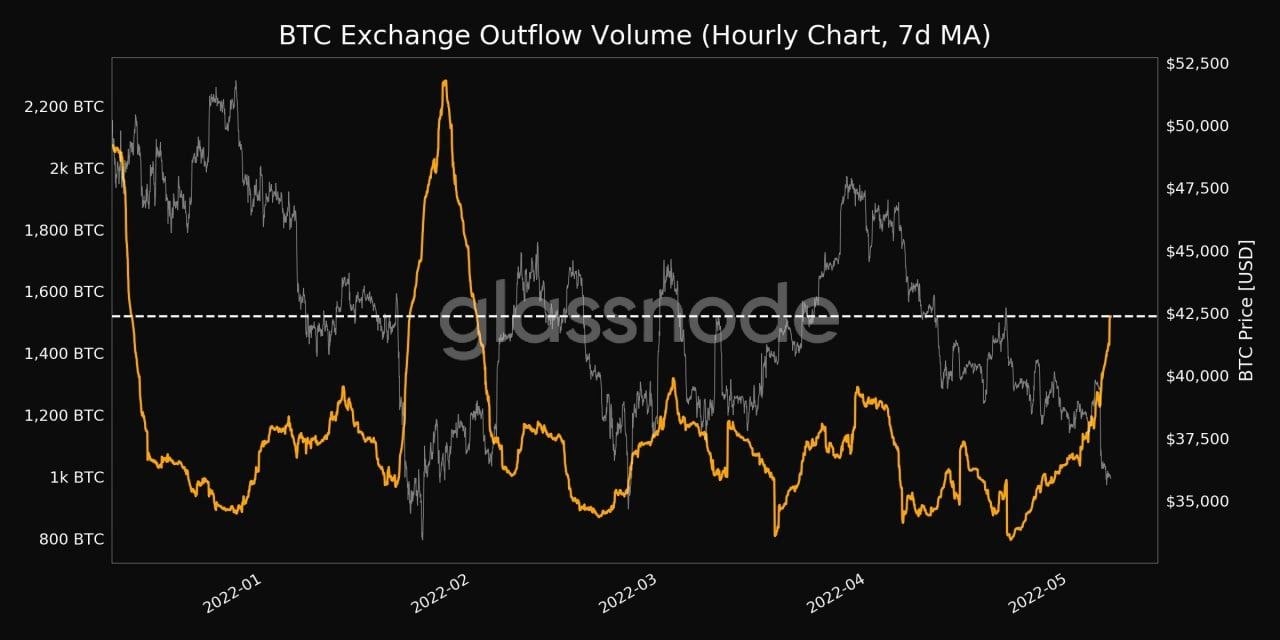
Further to Luna, it seems that other whales could also have taken the dip to accumulate more BTC as exchange outflows hit a 3-month high. While it cannot prove that the BTC withdrawn was recently bought, nonetheless, a surge in exchange outflow is definitely more bullish than a surge in exchange inflow. Around 1,519,372 BTC have been withdrawn from exchanges last week as the price dipped.
ETH Saw Biggest ETH Burn To-Date
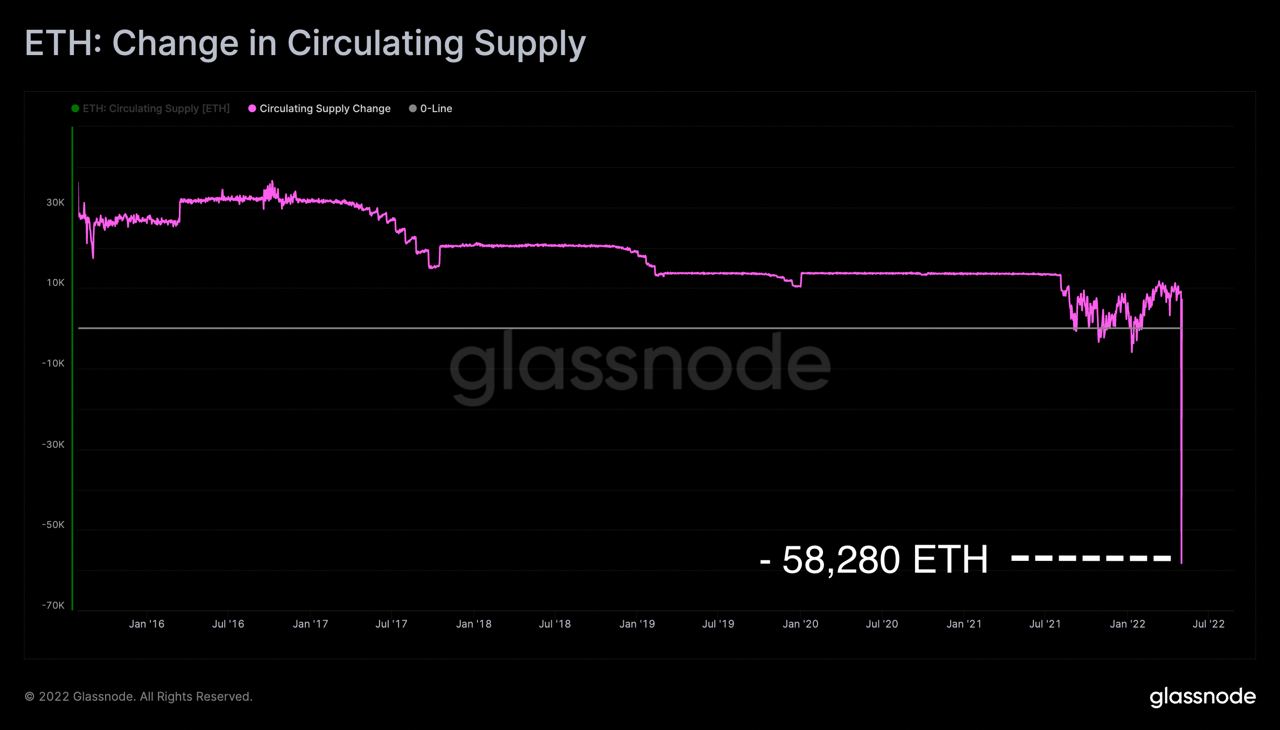
The “Otherside” NFT mint by Yuga Labs on May 1 led to record highs in ETH fee-related metrics.
With a net change of -58,280 ETH in circulating supply due to burned fees, this day was the most deflationary in ETH’s history. As of now, more than 2.2 million units of ETH worth more than $6.68 billion have been burned, and more high-burn rate projects like “Otherside” NFT will burn even more ETH, which is long-term bullish for the price of ETH.
ETH Shows Sign of Bottoming
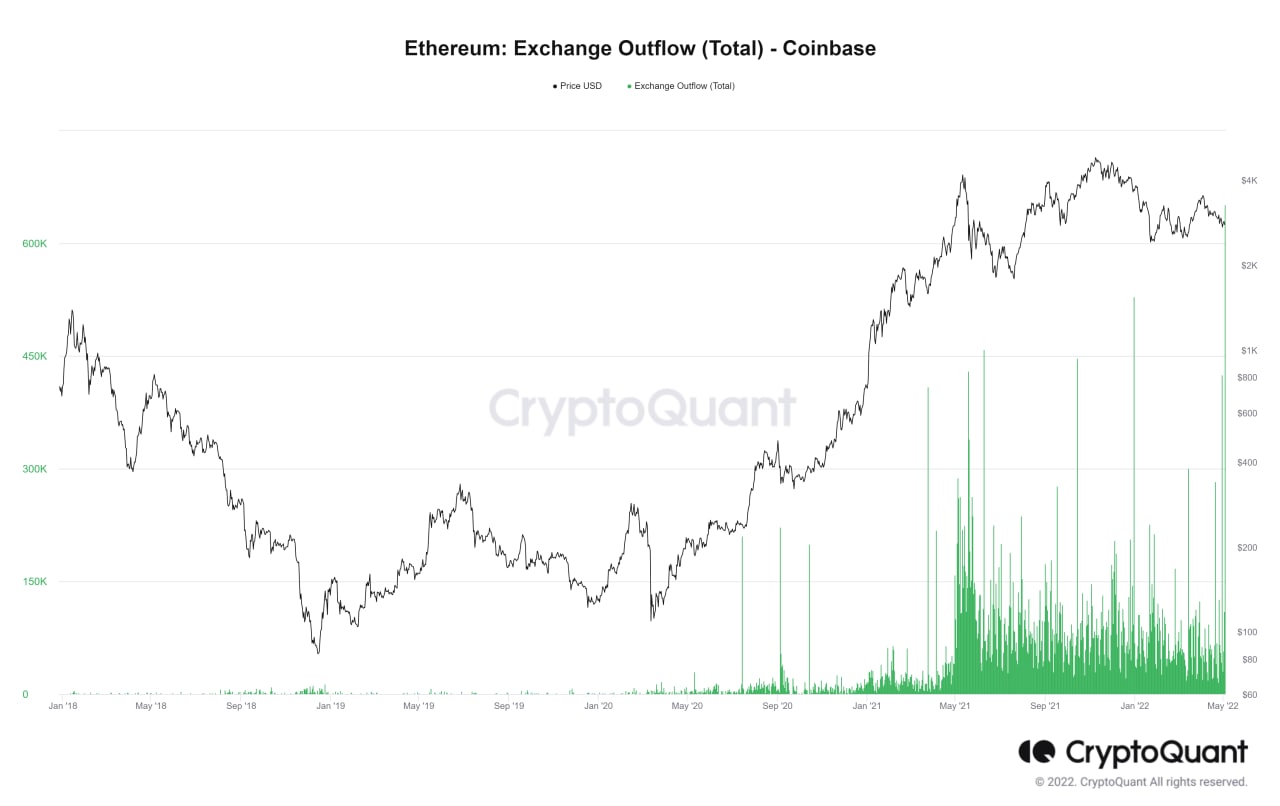
Last week, ETH witnessed its largest withdrawal on an exchange to-date. On May 3, more than 600,000 ETH had been withdrawn from Coinbase, in what appeared to be a large whale purchase.
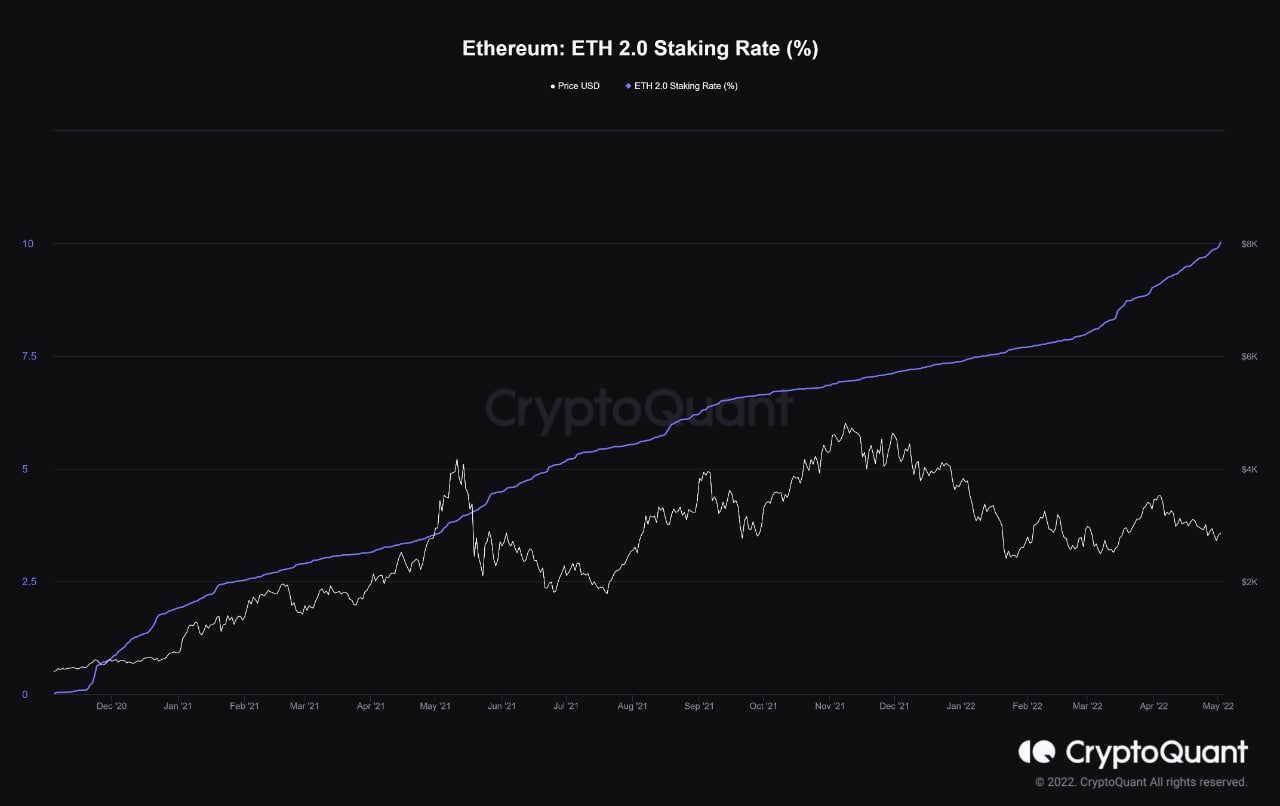
Staking on ETH 2.0 has picked up pace since mid-March when prices pulled back, and has gained momentum again in May as the date of the Merge nears. Could the large whale withdrawal from Coinbase be put into staking as well? In any case, these developments are bullish for ETH for the long-term since more and more ETH is being removed from circulation.
While the whale has been aggressively accumulating, one onchain metric shows that other investors could be actively dumping ETH as the amount of ETH being sold at a loss was at a three and a half year high.
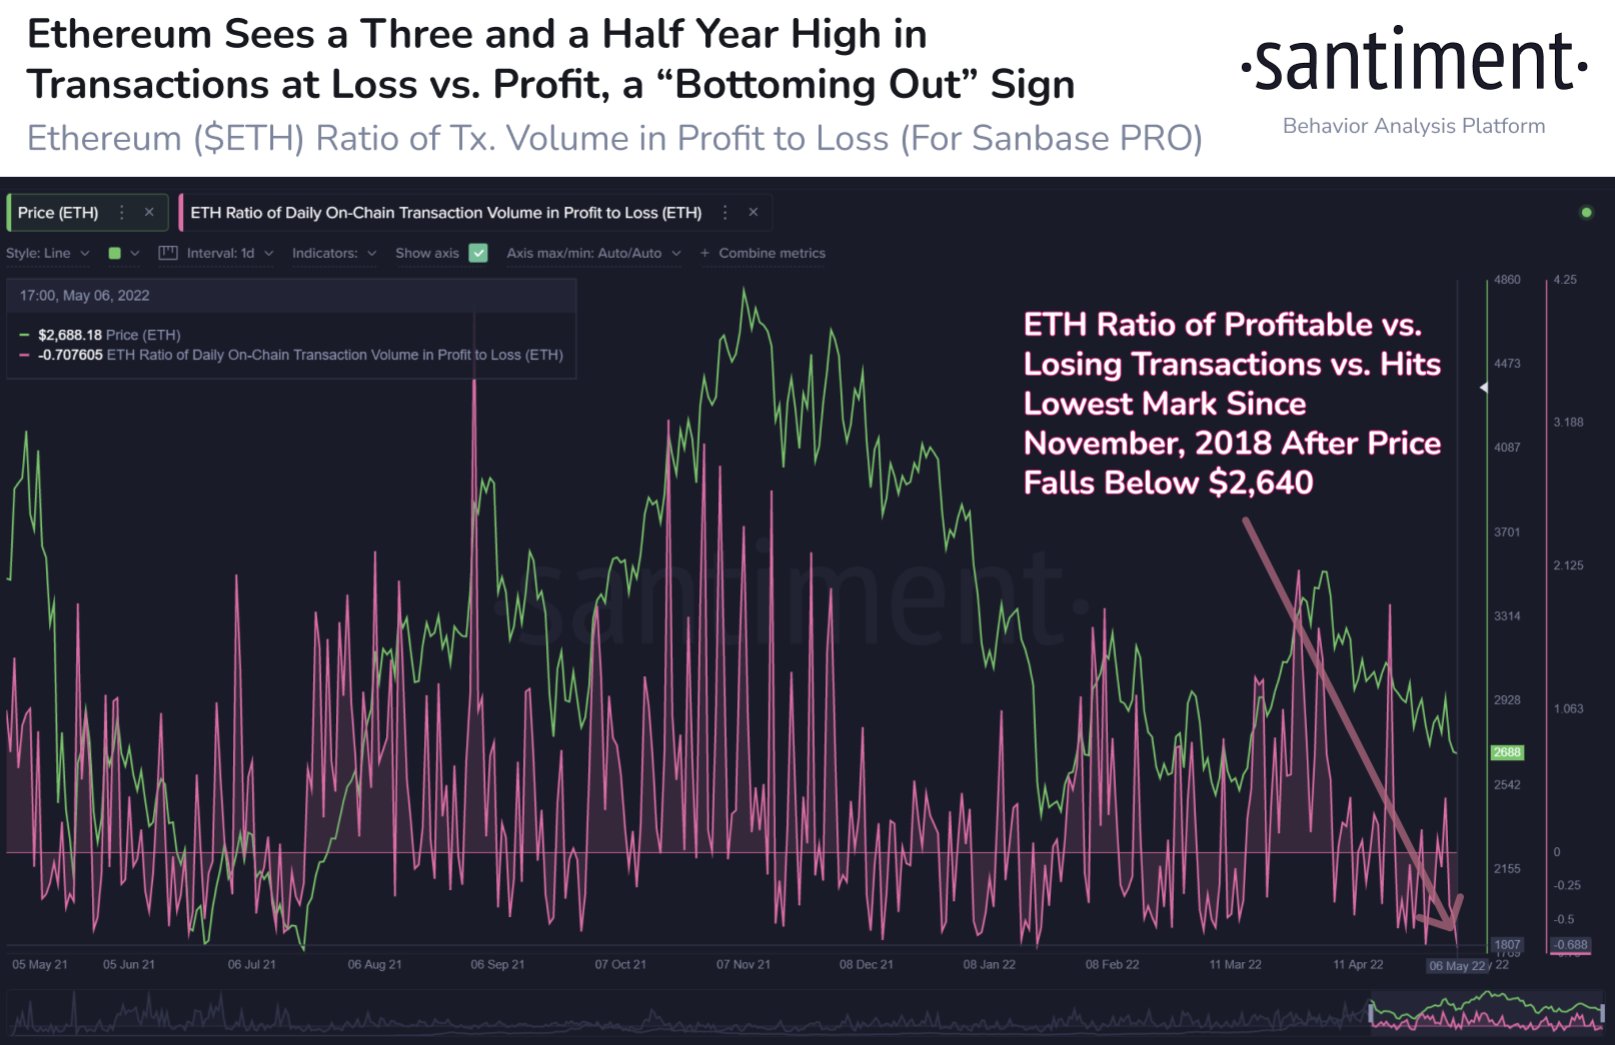
Metrics showed that there were about 3.4 times as many transactions taken while coins were at a loss compared to in profit, on Friday. This was the highest capitulation ratio since November 2018, or 3.5 years ago. Some experts view this as a bottoming signal since a high capitulation rate means that most people who had wanted to sell, have sold.
TRX Surges As Algo Stablecoin Launches, LUNA Victimised
While the broad market was bloodletting, one particular token stood out as it gained ground against the huge selling tide. The token is TRX, the native token of the Tron blockchain.
The much-publicised USDD algorithmic stablecoin that Justin Sun had been promoting for weeks was finally successfully launched on Thursday. With more than $100 million very quickly issued, public perception on the project improved greatly and the TRX token surged more than 30% last week, albeit with high volatility as it tried to wrestle against short-sellers who tried to make use of the negative broad market sentiment to stop TRX from going up. Eventually, TRX managed to clock a gain of around 30% to close the week around $0.09, an impressive move in a beaten and bruised market.
However, with the rise of yet another new algorithmic stablecoin, the incumbent Terra blockchain has seen its native token LUNA hammered over the weekend, dropping around 18% as the UST stablecoin depegged again. Whether this was the impact of the new competitor is unknown. However, the outflow of UST on Terra DeFi dropped 18% over the weekend, with outflow amounting to more than $2.2 billion. May 7 even saw the highest outflow to date of $1.3 billion. Funds moving out of the Terra ecosystem appears to be benefitting TRX and NEAR, the two other blockchains with their own algorithmic stablecoins. While TRX has risen 30% from a week ago, NEAR is seeing signs of life, rebounding more than 10% today from its 20% fall last week.
However, with BTC breaching $35,000 and drifting towards $33,000 over quiet trading, it is anybody’s guess as to whether any gains in price by altcoins can be sustained, although the market has become somewhat oversold and a near-term bounce should not be ruled out. To illustrate, the Crypto Greed and Fear Index has fallen to the Extreme Fear reading of 11 at the moment, one of the lowest levels in recent times. This is the second lowest reading next to the reading of 10 during the COVID-induced plunge of March 2020.
The content provided here is for informational purposes only. It is not intended as personal investment advice and does not constitute a solicitation or invitation to engage in any financial transactions, investments, or related activities. Past performance is not a reliable indicator of future results.
The financial products offered by the Company are complex and come with a high risk of losing money rapidly due to leverage. These products may not be suitable for all investors. Before engaging, you should consider whether you understand how these leveraged products work and whether you can afford the high risk of losing your money.
The Company does not accept clients from the Restricted Jurisdictions as indicated in our website/ T&C. Some services or products may not be available in your jurisdiction.
The applicable legal entity and its respective products and services depend on the client’s country of residence and the entity with which the client has established a contractual relationship during registration.


