14 min read
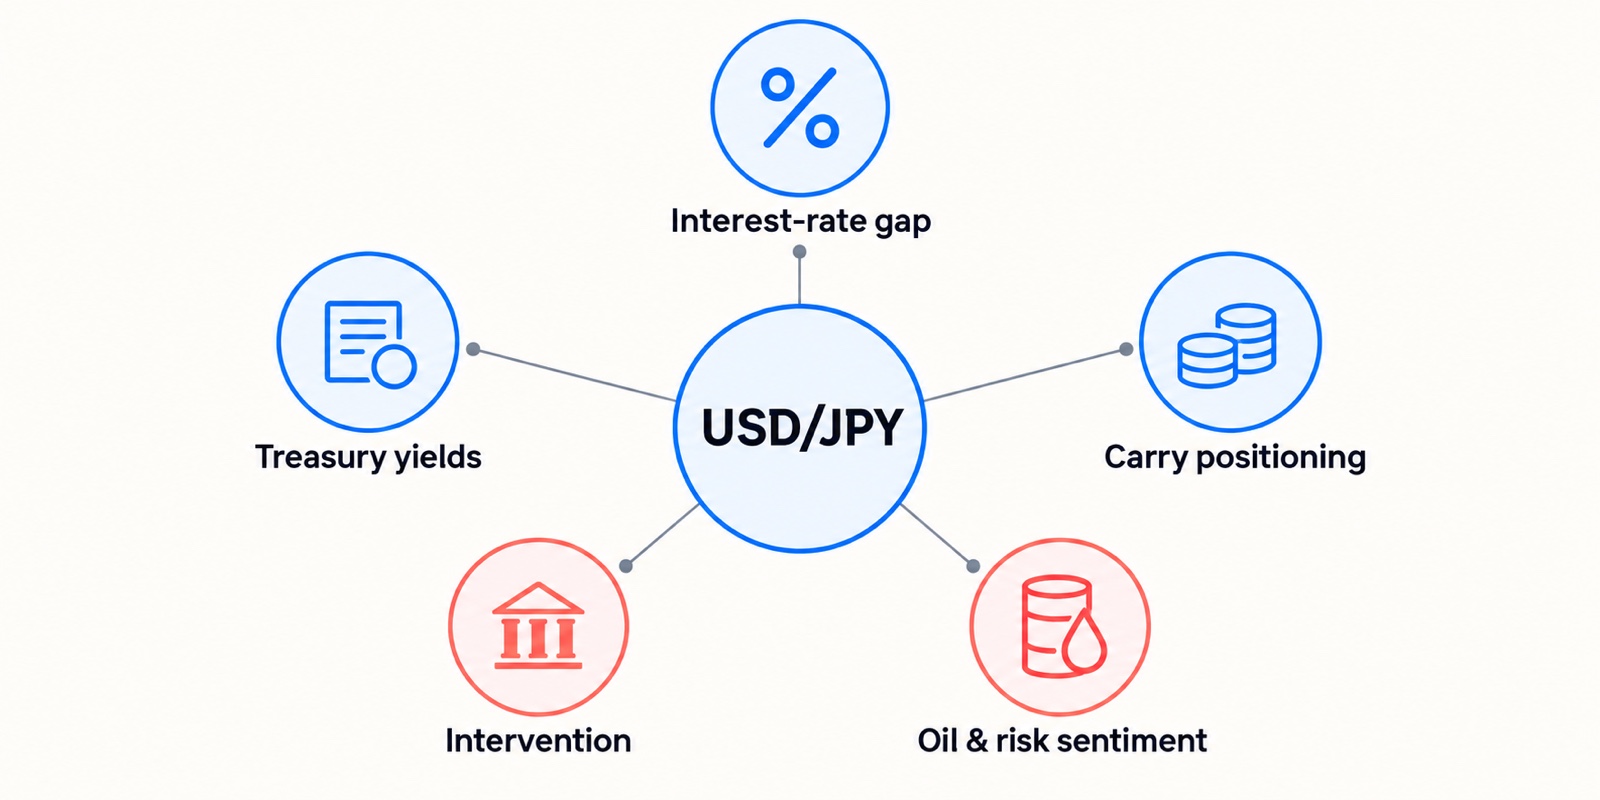
 USD/JPY moves when the expected return on dollar assets shifts against the expected return on yen assets. The US-Japan interest-rate gap anchors the direction. Carry positioning, Treasury yields, Japanese capital flows and intervention by Tokyo decide how far and how fast the move runs before it stalls.
The summer of 2026 showed how loosely those pieces fit together. On 16 June the Bank of Japan raised its policy rate to the highest level since 1995. Six weeks later the yen sat at a 40-year low against the dollar. On 31 July the Bank left rates alone, and that same day Japan’s Ministry of Finance bought yen in coordination with the US Treasury, the first joint operation since 2011. Within a fortnight the yen had given back most of what the intervention won.
A 30-year-high policy rate, then two treasuries buying together, and the pair went back to where it started. If you want to trade USD/JPY rather than watch it, that is the puzzle to hold in your head.
The Rate Gap Anchors the Direction
Start with the expected difference between US and Japanese interest rates. When investors expect US rates to stay above Japanese rates for longer, dollar cash and dollar bonds pay more to hold. When that expected gap narrows, the incentive fades.
Expected does the work in that sentence. Markets price a sequence of decisions stretching years ahead, so a policy meeting that delivers exactly what everyone forecast often moves the pair less than a single sentence in the press conference that follows it.
Japan supplies the cleanest demonstration. On 19 March 2024 the Bank of Japan ended the world’s last negative-rate regime and abandoned yield curve control, the most consequential shift in Japanese monetary policy in a generation. The yen weakened afterwards. Traders had already priced the exit, and what they took from the guidance was that the pace of further tightening would stay slow. The gap that mattered stayed wide.
The June 2026 hike repeated the lesson. Taking the policy rate to a 30-year high does not close a spread when the other side sits several points above it and the market doubts you will keep going. The yen slid for another six weeks.
So comparing today’s two policy rates tells you less than you would like. It gives you a snapshot of a relationship the market trades as a forecast. A useful first question for the pair is not where rates are, but whether the expected path of either central bank changed this week. New to the mechanics? The guide to trading currencies covers how rate expectations feed into quoted prices.
Why USD/JPY Moves With US Treasury Yields
Policy rates are one point on a curve. Treasury yields price the whole thing: the expected path of Fed policy, expected inflation, and the extra compensation investors demand for locking money up. That is why the pair can lurch on a Treasury repricing in a week when neither central bank meets.
Rising yields sometimes point to a better return on dollar assets. Read the reason before you read the direction. Yields climb because growth data came in hot, because inflation looks sticky, or because the bond market is worried about fiscal supply, and those three stories carry different messages for the dollar and for risk appetite. A yield rise driven by a term-premium scare can push the dollar the other way, because it prices risk rather than growth.
Split the curve. Short maturities track expected central-bank policy closely. Long maturities carry more inflation and supply information. A headline about “higher yields” that never says which end moved is not telling you much.
Japanese government bonds belong in the same frame. The yield spread between comparable US and Japanese maturities is the number desks quote at each other, and it has narrowed since the Bank of Japan began creeping away from zero. The pair still does not trade as a spread chart. Put an intervention headline or a genuine risk shock in front of it and the correlation vanishes for days at a time.
The Carry Trade Decides How Fast USD/JPY Moves
For decades Japanese rates sat below those of every other major economy, and the yen became the world’s default funding currency. Borrow in yen, buy something that yields more, keep the difference. The rate gap is the attraction. The exchange rate is the risk, and the exchange rate is what ends the trade.
Carry builds quietly while volatility stays low and the spread looks stable. It unwinds all at once. August 2024 is the reference case, and the sequence is worth memorising because it repeats in outline.
The Bank of Japan hiked on 31 July 2024 with hawkish guidance. On 2 August weak US labour data made the Fed look too tight and pulled Treasury yields down, squeezing the spread from both ends at once. On 5 August Japanese equities fell hard, the VIX briefly topped readings last seen during the pandemic, and the yen surged as leveraged short-yen positions were closed into a market with no bid.
Then the part most retellings leave out. By the close on Friday 9 August, US equities had recovered everything lost that week and Japanese equities had recovered most of it. Four days.
An unwind is a liquidity event wearing macro clothing. The expected rate path did change that week, and the Bank for International Settlements still read the episode as an amplification by leverage rather than a repricing of fundamentals. Positioning supplied the violence. A four-day round trip is the proof, because fundamentals do not reverse in four days.
Two practical notes. The mechanism reaches past foreign exchange, because yen funding also sits behind positions in foreign bonds and equities, so an unwind shows up in markets that have nothing to do with Japan. And a CFD position carries its own overnight funding treatment, which does not replicate the economics of an institutional carry trade. The pair is a symptom of the unwind, not a full measure of it.
Intervention: Who Decides, and What It Buys
Japan’s currency intervention is a government decision, not a central-bank one. The Ministry of Finance decides whether to act. The Bank of Japan executes as its agent. Keeping that straight matters, because a monetary policy decision and an intervention decision come from different mandates and routinely point in opposite directions.
Japan’s recent record is short enough to list:
- 22 September 2022: Japan bought yen for the first time in roughly 24 years.
- Late September to late October 2022: further operations, conducted without announcement and confirmed only in the monthly data.
- Late April and early May 2024: a fresh round after the yen slid past levels officials had called excessive.
- 30 April, 4 May and 6 May 2026: three separate days of buying.
- 31 July 2026: Tokyo acted again, this time with the US Treasury buying yen alongside it, under a framework the two finance ministries had set out in a joint statement in September 2025.
That last entry broke a pattern. Washington had not joined a yen operation since 2011, when the G7 acted together to weaken the yen after the Tōhoku earthquake. Japan buying yen with American help is a different signal from Japan buying yen alone, and it briefly made short-yen positions far more dangerous to hold. Tokyo announced it on 3 August, citing excessive volatility and disorderly moves.
Briefly. The yen jumped to a three-month high, then gave the move back over the following fortnight. Intervention does not touch the rate gap, the growth outlook, or global demand for yield. It changes the risk of standing on one side of a fast move, which buys time and volatility rather than a trend.
Treat a specific exchange rate as a trigger level at your peril. Officials talk about speed and disorder, not thresholds, and the language they use (“excessive,” “disorderly,” “watching with a high sense of urgency”) escalates in a rough order that market participants track more closely than any number.
The Slow Flow: Japanese Money Leaving Japan
Rate differentials and carry explain the fast moves. They do not explain why the yen spent four years grinding toward multi-decade lows against a dollar whose own rate path kept shifting. Part of the answer is a structural bid for foreign currency coming out of Japan itself.
In January 2024 Japan launched a revamped NISA, a tax-free investment account with far higher limits than the old version. It worked. Japanese households moved savings into investment, and a large share of that money went into funds holding foreign equities. Every purchase sells yen. Japan’s Ministry of Finance data showed domestic investment trusts buying trillions of yen more in offshore equities and fund shares than they sold across the first half of 2024, a flow running ahead of the country’s trade deficit over the same stretch.
Institutions add to it. Life insurers and pension funds hold large foreign bond portfolios, and their hedging ratios move with the cost of hedging, which is itself a function of the rate gap. When dollar hedging gets expensive, hedge ratios fall, and an unhedged foreign bond portfolio is a standing short-yen position.
Then there is energy. Japan imports most of what it burns, and the import bill is paid in dollars.
None of this generates a tradeable signal on a Tuesday afternoon. It explains the slope underneath the noise, and why yen rallies driven by positioning keep fading back. Monthly flow data from the Ministry of Finance is the place to watch it.
What Moves USD/JPY Intraday: Gotobi Days and the Tokyo Fix
This one is specific to the pair, and most guides skip it.
Japanese banks set a customer exchange rate each morning at 9:55am Tokyo time. Corporate settlements cluster on days whose date is divisible by five, the 5th, 10th, 15th, 20th, 25th and 30th, plus month end. Tokyo desks call them gotōbi days. On those days the volume of importers buying dollars at the fix rises sharply.
Researchers at the NBER documented what that does to the price: the dollar tends to drift higher into 9:55am Tokyo time, then reverse afterwards. The mechanism is unglamorous. Japanese importers buy dollars at the fix as a matter of routine treasury operations, exporters manage their currency risk more actively and less predictably, and the resulting order imbalance is persistent enough that banks position ahead of it.
Keep the effect in proportion. It is measured in pips over a window of minutes, it decays as more people trade it, and it will not save a position that is wrong on the rate gap. But if you trade the Asian session and cannot work out why the dollar firmed for no apparent reason before Tokyo lunch on the 25th, now you know where to look. USD/JPY sits among the more volatile major pairs, and a chunk of that intraday range is plumbing rather than macro.
Oil and What “Risk-Off” Hides
Japan imports most of its energy, so a sustained move in oil prices shifts the import bill, the inflation outlook and the political argument about household costs. The route to USD/JPY runs through several rooms before it arrives.
Ask what is driving the oil move. Brent rising on strong global growth pulls the yen one way. Brent rising on a supply disruption or a geopolitical shock pulls it another, because that version also hits risk appetite and Japan’s terms of trade at the same time.
The same discipline applies to the phrase “risk-off,” which gets used as though it were a direction. The yen has often gained when markets de-risk, because de-risking means closing leveraged positions and a lot of leverage is funded in yen. That is a positioning effect, not a permanent safe-haven property. A growth scare that drags Treasury yields down and forces a carry unwind points one way with both hands. An energy shock that raises global inflation while worsening Japan’s import costs does not point anywhere clean.
Which shock, and which channel it travels down, tells you more than the label.
Reading the Calendar, and What’s Already Priced
The releases that move USD/JPY are the ones that change the expected path of either central bank. US inflation, payrolls and wages reset the Fed view. Japanese inflation, wage settlements, growth data and Bank of Japan communication reset the domestic one. What matters is the distance between the number and the consensus, not whether the number looks high.
One release rarely settles anything. A hot inflation print loses force if wage data and central-bank guidance lean the other way, and a rate decision can produce a counterintuitive move when the outcome was fully priced and the guidance disappointed. Liquidity thins around releases, so the first reaction and the reaction 90 minutes later often disagree. An economic calendar gives you the schedule and the consensus figure; it does not tell you what the market already owns.
For that, read positioning. The CFTC publishes its Commitments of Traders report every Friday, showing how large speculators are positioned in yen futures. It lags by three days and it covers only the futures market, so treat it as a rough gauge, not a picture of global exposure. It still answers the question that matters most after a long trend.
A crowded consensus has nowhere left to go. That is what made 5 August 2024 violent, and it is why the most dangerous moment for any USD/JPY view is the week everyone finally agrees with it.
Trading involves risk.
What moves USD/JPY the most?
The expected gap between US and Japanese interest rates is the anchor, because it sets how much more dollar assets pay to hold than yen assets. Treasury yields, carry positioning, Japanese capital outflows and intervention by Tokyo then decide how far and how fast a move runs.
Why does USD/JPY move with US Treasury yields?
Treasury yields price the expected path of Fed policy, inflation and the compensation investors want for holding long-dated bonds. When they reprice, the relative appeal of dollar assets changes with them. The link breaks down during risk shocks and around Japanese intervention, so read why yields moved before reading the direction.
What is a yen carry trade?
Borrowing or funding in yen, which has paid little for decades, to hold a higher-yielding currency or asset. The rate difference is the return and the exchange rate is the risk. Carry builds slowly in calm markets and unwinds violently, as it did in the first week of August 2024.
Can Japan intervene in USD/JPY?
Yes. Japan's Ministry of Finance decides, and the Bank of Japan carries out the transactions as its agent. Japan bought yen in September and October 2022, in spring 2024, and twice in 2026. The second 2026 round, on 31 July, had the US Treasury buying alongside it, the first joint operation since 2011.
Does intervention change the trend in USD/JPY?
Rarely on its own. Intervention raises the risk of holding one side of a fast move, which buys time and volatility. It does not alter the interest-rate gap or global demand for yield, so the yen gave back most of its post-intervention gains within a fortnight in August 2026.
What are gotobi days in USD/JPY?
Days whose date is divisible by five, plus month end, when Japanese corporate settlements cluster. Importer demand for dollars concentrates at the 9:55am Tokyo fix, and research has found the dollar tends to firm into the fix and reverse after. The effect is intraday and small, not a trend driver.
Author


 Risk Disclaimer
The content provided here is for informational purposes only. It is not intended as personal investment advice and does not constitute a solicitation or invitation to engage in any financial transactions, investments, or related activities. Past performance is not a reliable indicator of future results.
The financial products offered by the Company are complex and come with a high risk of losing money rapidly due to leverage. These products may not be suitable for all investors. Before engaging, you should consider whether you understand how these leveraged products work and whether you can afford the high risk of losing your money.
The Company does not accept clients from the Restricted Jurisdictions as indicated in our website/ T&C. Some services or products may not be available in your jurisdiction.
The applicable legal entity and its respective products and services depend on the client’s country of residence and the entity with which the client has established a contractual relationship during registration.